Copyright 2003, J4L
Components (http://www.java4less.com)
Go bak to contents
This parameters can only be used in the interactive version of the applet:
|
Parameters
|
Description
|
Equivalent Java[TM] class/property
|
|
WIDTH=300 |
Size of the applet |
chart.setSize(300,300); |
After you press the zoom out (-) button the result is:
If you want to disable the zoom buttons you must use the following parameter:
If you use Java[TM] code you must use the iChart class in the following way:
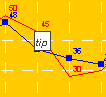
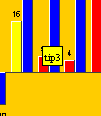
If you want to display tips when the mouse is placed over a bar, point or item you can use these parameters:
you can use "\n" in order to create multiline tips.
Use the following parameters to change the look of the tips:
if you also want to display the current position (Y axis value) of the cursor you can use:
CHART_SHOW_POSITION=true
|
Parameters
|
Description
|
Equivalent Java[TM] class/property
|
|
CHART_SHOW_TIPS=TRUE |
Activate tips |
See Section Chart Listener (implementing tips and actions) |
In the same way, you can also display tips in barcharts of in piecharts:
There is a special kind of tip which always displays the current possition of the cursor according to the Y scale:
|
Parameters
|
Description
|
Equivalent Java[TM] class/property
|
|
CHART_SHOW_POSITION=TRUE |
Activate possition tips |
See Section Chart Listener (implementing tips and actions) |
In the screenshot you see that the cursor was at possition 15.
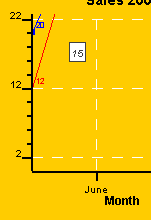
Note: See next section if you want to use tips with the servlet.
RChart (only the applet or the servlet) will open an HTML when the user clicks on bar (barchart), point (linechart) or item (piechart). In order to activate this feature you must set the parameter: SERIE_LINKS_*.
For example, if your data series 1 has 3 values, you can set the parameter like this:
SERIE_LINKS_1=http://www.server.com/value1.html|http://www.server.com/value2.html|http://www.server.com/value3.html
Furthermore you can specify the frame where the HTML page will be displayed:
CHART_LINKS_TARGET=_new
Valid values are: "_new" (new browser's window) , "_top" (current window) and "<frame name>" (if you use frames).
Example:
1. Create a file called ChartLinks.html with the following code:
<html>
<head>
</head>
<frameset cols="350,*" frameborder=0 framespacing=0 border=0>
<frame src="chart.html" name="chart" scrolling=auto noresize>
<frame src="empty.html" name="dataframe" marginwidth="18" scrolling=auto noresize>
</frameset><noframes></noframes>
</html>
This file contains 2 frames, the left frame contains the chart, the right frame (dataframe) is where the links will be openned.
2. Create a empty HTML file called empty.html
3. Create a file called chart.html with the following code:
<HTML>
<BODY>
<APPLET
CODEBASE = "./"
ARCHIVE = "rchart.jar"
CODE = "com.java4less.rchart.ChartApplet.class"
NAME = "TestApplet"
WIDTH = 330
HEIGHT = 270
>
<PARAM NAME="WIDTH" VALUE="330">
<PARAM NAME="HEIGHT" VALUE="270">
<PARAM NAME="TITLECHART" VALUE="Sales 2002">
<PARAM NAME="XLABEL" VALUE="Month">
<PARAM NAME="YLABEL" VALUE="Million $">
<PARAM NAME="XSCALE_MIN" VALUE="0">
<PARAM NAME="YSCALE_MIN" VALUE="0">
<PARAM NAME="XSCALE_MAX" VALUE="5.5">
<PARAM NAME="BIG_TICK_INTERVALX" VALUE="1">
<PARAM NAME="BIG_TICK_INTERVALY" VALUE="10">
<PARAM NAME="XAXIS_LABELS" VALUE="June|July|Aug.|Sept.|Oct.|Nov.|Dec.">
<PARAM NAME="CERO_XAXIS" VALUE="LINE">
<PARAM NAME="YAXIS_INTEGER" VALUE="TRUE">
<PARAM NAME="LEGEND_FILL" VALUE="WHITE">
<PARAM NAME="LEGEND_BORDER" VALUE="0.2|0x0|NORMAL">
<PARAM NAME="SERIE_1" VALUE="Java4less">
<PARAM NAME="SERIE_2" VALUE="Other">
<PARAM NAME="SERIE_TYPE_1" VALUE="BAR">
<PARAM NAME="SERIE_TYPE_2" VALUE="BAR">
<PARAM NAME="SERIE_TIPS_1" VALUE="click to go |click to go |click to go |click to go |click to go |">
<PARAM NAME="SERIE_LINKS_1" VALUE="http://www.java4less.com|http://www.java4less.com|http://www.java4less.com|http://www.java4less.com|http://www.java4less.com|http://www.java4less.com|http://www.java4less.com|http://www.java4less.com">
<PARAM NAME="SERIE_FONT_1" VALUE="Arial|PLAIN|8">
<PARAM NAME="SERIE_FONT_2" VALUE="Arial|PLAIN|8">
<PARAM NAME="SERIE_DATA_1" VALUE="12|43|50|45|30">
<PARAM NAME="SERIE_DATA_2" VALUE="10|41|48|39|36">
<PARAM NAME="SERIE_BORDER_TYPE_1" VALUE="RAISED">
<PARAM NAME="SERIE_BORDER_TYPE_2" VALUE="RAISED">
<PARAM NAME="SERIE_BAR_STYLE_1" VALUE="0xff00">
<PARAM NAME="SERIE_BAR_STYLE_2" VALUE="0xff">
<PARAM NAME="SERIE_NEEDLE_STYLE_1" VALUE="3.0|0x0|NORMAL">
<PARAM NAME="SERIE_NEEDLE_STYLE_2" VALUE="3.0|0x0|NORMAL">
<PARAM NAME="BARCHART_BARSPACE" VALUE="1">
<PARAM NAME="BARCHART_BACK" VALUE="0xffcc00">
<PARAM NAME="LEFT_MARGIN" VALUE="0.15">
<PARAM NAME="CHART_BORDER" VALUE="0.2|0x0|NORMAL">
<PARAM NAME="CHART_FILL" VALUE="0xffcc00">
<PARAM NAME="CHART_SHOW_TIPS" VALUE="TRUE">
<PARAM NAME="CHART_LINKS_TARGET" VALUE="dataframe">
<\APPLET>
<\BODY>
<\HTML>
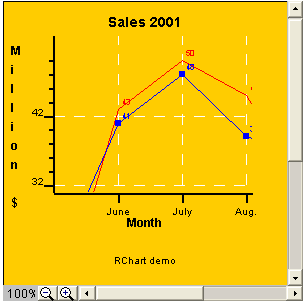
4. Place rchart.jar in the same directory as the files and open ChartLinks.html. The result will be:
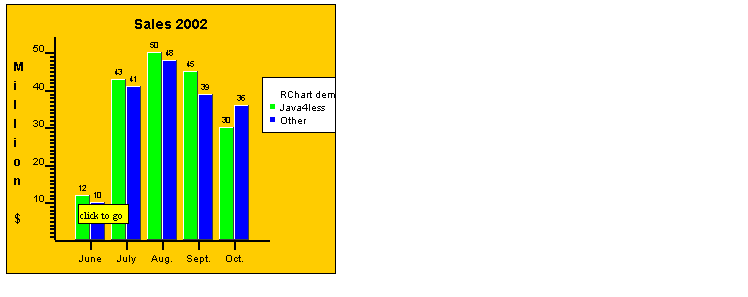
5. Click now on one green bar. The link http://www.java4less.com will be openned on the right frame of the browser:
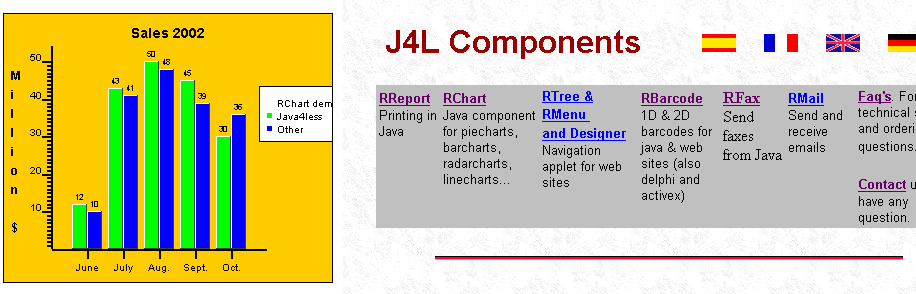
This has been achieved by means of the following parameters:
|
Parameters
|
Description
|
Equivalent Java[TM] class/property
|
|
CHART_SHOW_TIPS=TRUE |
Activate tips |
See Section Chart Listener (implementing tips and actions) |
If you want to activate Tips of Links using the servler you must use 2 servlets:
The following JSP[TM] page can be used to call both servlets and get an image with tips and links:
<jsp:include page="servlet/RChartMapServlet" flush="true">
<jsp:param name="DATAFILE" value="http://localhost:8080/rchart/data/dataFile.html"/>
</jsp:include><img src="http://localhost:8080/rchart/servlet/RChartServlet?DATAFILE=http://localhost:8080/rchart/data/dataFile.html" BORDER=0 ISMAP USEMAP="#CHARTMAP">
Note that the "inlcude page" directive works relative to the possition of the JSP[TM] file.
You can create drill down charts using the applet or the servlet in the following way:
For example, the following applet will create a Pie chart:
<HTML>
<HEAD>
<META HTTP-EQUIV="Content-Type" CONTENT="text/html; charset=windows-1252">
<TITLE>
HTML Test Page
</TITLE>
<SCRIPT>
function OnClickRChart(s,p) {if (p==0) {
document.TestApplet.loadFromFile('subchart1.html','N');
}
if (p==1) {
document.TestApplet.loadFromFile('subchart2.html','N');
}
if (p==2) {
document.TestApplet.loadFromFile('subchart3.html','N');
}document.TestApplet.rebuild('N','N');
}
function resetChart() {
document.TestApplet.rebuild('Y','Y');
}
</SCRIPT>
</HEAD>
<BODY bgcolor="#FFFFFF">
<BR>
<A HREF="javascript:resetChart()">Back to main Pie</A>
<BR>
<APPLET
CODEBASE = "."
CODE = "com.java4less.rchart.ChartApplet.class"
NAME = "TestApplet"
ARCHIVE = "rchart.jar"
WIDTH = 500
HEIGHT = 500
HSPACE = 0
VSPACE = 0
ALIGN = middle
MAYSCRIPT
>
<PARAM NAME = "TITLECHART" VALUE = "Sales 1999">
<PARAM NAME = "LEGEND" VALUE = "TRUE">
<PARAM NAME = "SERIE_1" VALUE = "Pie">
<PARAM NAME = "SERIE_TYPE_1" VALUE = "PIE">
<PARAM NAME = "PIE_STYLE_1" VALUE = "RED">
<PARAM NAME = "PIE_STYLE_2" VALUE = "BLUE">
<PARAM NAME = "PIE_STYLE_3" VALUE = "GREEN">
<PARAM NAME = "PIE_NAME_1" VALUE = "Products">
<PARAM NAME = "PIE_NAME_2" VALUE = "Services">
<PARAM NAME = "PIE_NAME_3" VALUE = "Other">
<PARAM NAME = "PIE_LABEL_FORMAT" VALUE = "#VALUE# (#PERCENTAGE#)">
<PARAM NAME = "SERIE_DATA_1" VALUE = "94|48|28">
<PARAM NAME = "SERIE_FONT_1" VALUE = "ARIAL|BOLD|12">
<PARAM NAME = "SERIE_LABELS_1" VALUE = "Products|Services|Other">
<PARAM NAME = "SERIE_TIPS_1" VALUE = "Click to see PRODUCT \nsales by continent|Click to see SERVICES \nsales by continent|Click to see OTHER \nsales by continent">
<PARAM NAME = "CHART_SHOW_TIPS" VALUE = "true">
<PARAM NAME = "CHART_JAVASCRIPT_EVENTS" VALUE = "true">
<PARAM NAME = "SERIE_TOGETHER_1" VALUE = "true|false|true">
<PARAM NAME = "CHART_BORDER" VALUE = "0.2|BLACK|LINE">
<PARAM NAME = "CHART_FILL" VALUE = "LIGHTGRAY">
<PARAM NAME = "LEGEND_BORDER" VALUE = "0.2|BLACK|LINE">
<PARAM NAME = "LEGEND_VERTICAL" VALUE = "false">
<PARAM NAME = "LEGEND_POSITION" VALUE = "TOP">
<PARAM NAME = "LEGEND_FILL" VALUE = "WHITE">
<PARAM NAME = "PIECHART_3D" VALUE = "true">
<PARAM NAME = "BACK_IMAGE" VALUE = "back19.jpg">
</APPLET>
</BODY>
</HTML>
The result is:
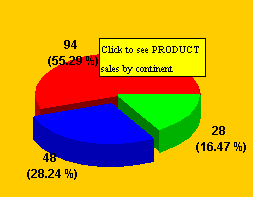
The following parameter is the key:
<PARAM NAME = "CHART_JAVASCRIPT_EVENTS" VALUE = "true">
when the users clicks in the piechart, the javascript function "OnClickRChart" will be executed. That function will then load the new chart from one of the data files subchart1.html, subchart2.html or subchart3.html depending on the slice the users clicked on.
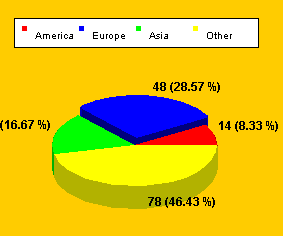
The content of subchart1.html can be:
TITLECHART=Sales Products
LEGEND=TRUE
SERIE_1=Pie
SERIE_TYPE_1=PIE
PIE_STYLE_1=RED
PIE_STYLE_2=BLUE
PIE_STYLE_3=GREEN
PIE_STYLE_4=YELLOW
PIE_NAME_1=America
PIE_NAME_2=Europe
PIE_NAME_3=Asia
PIE_NAME_4=Other
PIE_LABEL_FORMAT=#VALUE# (#PERCENTAGE#)
SERIE_DATA_1=14|48|28|78
SERIE_FONT_1=ARIAL|BOLD|12
SERIE_LABELS_1=America|Europe|Asia|Other
CHART_BORDER=0.2|BLACK|LINE
CHART_FILL=LIGHTGRAY
LEGEND_BORDER=0.2|BLACK|LINE
LEGEND_VERTICAL=false
LEGEND_POSITION=TOP
LEGEND_FILL=WHITE
PIECHART_3D=true
BACK_IMAGE=back19.jpg
CHART_JAVASCRIPT_EVENTS=false
SERIE_TIPS_1=America|Europe|Asia|Other
CHART_SHOW_TIPS=true
When the user click on the red slice, the following subchart will be loaded: