RCHART TUTORIAL, Chapter 10
Copyright 2003, J4L
Components (http://www.java4less.com)
Go bak to contents
RChart Applet
Applets are small Java[TM] programs that run inside your browser, this means they
must be first downloaded from the server so that they can be executed by your
browser.
In order to run applets your browser must be Java[TM] enabled. RChart will run
in old browsers also since it also runs with Java[TM] platform version 1.1 or later.
Applet are downloaded and executed when the brower finds the <APPLET>
tag inside the HTML code. The tag has the following structure:
<APPLET
CODE=...
CODEBASE=..
NAME=...
WIDTH=...
HEIGHT
>
<PARAM NAME = "appletParameter1" VALUE
= "value1">
<PARAM NAME = "appletParameter2" VALUE = "value2">
<PARAM NAME = "appletParameter3" VALUE = "value3">
.....
< /APPLET>
The green code is used to configurate the applet (size, name, class to
be executed), and the blue code is used to pass parameters to the applet. These
are the parameters you use to define a chart. As you see the chart definition
is part of the <Applet> tag contained in the HTML page, however it is
also possible to read the chart definition from a separate file.
You can of course dinamically create this HTML code using a server side script
(ASP, Php, Jsp), you can see some examples in this chapter.
My
first applet
RChartApplet can be executed with so litte code as:
<HTML>
<BODY>
<APPLET
CODEBASE = "./"
CODE = "com.java4less.rchart.ChartApplet.class"
NAME = "TestApplet"
ARCHIVE = "rchart.jar"
WIDTH = 500
HEIGHT = 500
ALIGN = middle
>
<PARAM NAME = "TITLECHART" VALUE = "Sales 1999">
<PARAM NAME = "XLABEL" VALUE = "Month">
<PARAM NAME = "YLABEL" VALUE = "Million $">
<PARAM NAME = "SERIE_1" VALUE = "Products">
<PARAM NAME = "SERIE_DATA_1" VALUE = "12|43|50|45|30|32|42">
</APPLET>
</BODY>
</HTML>
In order to run this applet you must:
- copy this code to a file: Applet.html
- copy rchart.jar to the same directory
- Open Applet.html with your browser
Of course this is a very simple and ugly chart, you should now add new parameters
to get a nicer chart.
It is also possible to have the chart parameters in a separate file, this is
done like this:
- Copy the following code to applet.html
<HTML>
<BODY>
<APPLET
CODEBASE = "./"
CODE = "com.java4less.rchart.ChartApplet.class"
NAME = "TestApplet"
ARCHIVE = "rchart.jar"
WIDTH = 500
HEIGHT = 500
HSPACE = 0
VSPACE = 0
ALIGN = middle
>
<PARAM NAME = "DATAFILE" VALUE = "data.html">
</APPLET>
</BODY>
</HTML>
- Copy the following code to data.html
XLABEL=Month
YLABEL=Million $
SERIE_1=Products
SERIE_DATA_1=12|43|50|45|30|32|42
- copy rchart.jar to the same directory
- Open Applet.html with your browser
As you can see the result is the same, but the chart parameters are read from
a external file (which could be a JSP[TM] , ASP , cgi ...). Format of the external
file is:
PARAMETERNAME=VALUE
Note: make sure there are not trailing spaces after VALUE.
Deploying
the applet
When you deploy the applet to your server you will need to copy the following
2 files:
- rchart.jar: contains the applet (see CODEBASE parameter)
- the HTML page that uses the applet (or JSP[TM], ASP, Php ....)
The following parameters are used to configurate the applet:
|
Parameters
|
Description
|
|
<APPLET
CODEBASE = "./"
CODE = "com.java4less.rchart.ChartApplet.class"
NAME = "TestApplet"
ARCHIVE = "rchart.jar"
WIDTH = 500
HEIGHT = 500
ALIGN = middle
MAYSCRIPT
>
|
Definition of the scale
This is the directory where rchart.jar should be located.
This is the name of the applet, you cannot change it.
Name you want to give to your applet.
This is the file where the applet is located.
Size of the applet (in pixels), can also be defined as % of the page's
size, for example WIDTH=50% and Height=%50
Alignment
You need to include this keyword if you are going to use the OnClickRChart()
javascript function.
|
Realtime
applets
If you want to update the chart (the applet) every X seconds with new data
from your server you must configure the applet like this:
- Set the following parameter to set the update frecuency (the default is
2000= 2 seconds): REALTIME_MSECS=2000.
- Set the data file (Url) where the new data should be read from. The parameter
is: REALTIME_DATAFILE=http://myserver.com/updateData.asp
where the program "updateData.asp" (can also be php, jsp ...) must
return the parameters in the usual format (PARAMETERNAME=VALUE). For example
it might return this information: "SERIE_DATA_1= 12|34|46|56" in order
to update the values for serie 1.
RChart will also trigger a Javascript function called "OnRChart()"
if you set REALTIME_JS=true.
This is an example of a bar chart being updated every 2 seconds (default value
for REALTIME_MSECS):
- Copy this code to a file named realtime.html:
</HEAD>
<BODY>
<BR>
<APPLET
CODEBASE = "."
CODE = "com.java4less.rchart.ChartApplet.class"
ARCHIVE=rchart.jar
NAME = "TestApplet"
WIDTH = 300
HEIGHT = 300
HSPACE = 0
VSPACE = 0
ALIGN = middle
>
<PARAM NAME = "TITLECHART" VALUE = "Sales 1999">
<PARAM NAME = "LEGEND" VALUE = "TRUE">
<PARAM NAME = "XLABEL" VALUE = "Month">
<PARAM NAME = "YLABEL" VALUE = "Million $">
<PARAM NAME = "XAXIS_LABELS" VALUE = "June|July|Aug.|Sept.|Oct.|Nov.|Dec.">
<PARAM NAME = "SERIE_1" VALUE = "Products">
<PARAM NAME = "SERIE_2" VALUE = "Services">
<PARAM NAME = "SERIE_TYPE_1" VALUE = "BAR">
<PARAM NAME = "SERIE_TYPE_2" VALUE = "BAR">
<PARAM NAME = "SERIE_STYLE_1" VALUE = "RED">
<PARAM NAME = "SERIE_BARS_COLORS_1" VALUE = "WHITE|YELLOW">
<PARAM NAME = "SERIE_STYLE_2" VALUE = "BLUE">
<PARAM NAME = "SERIE_FONT_1" VALUE = "Arial|PLAIN|8">
<PARAM NAME = "SERIE_FONT_2" VALUE = "Arial|PLAIN|8">
<PARAM NAME = "SERIE_DATA_1" VALUE = "10|43|50|45|30|32|42">
<PARAM NAME = "REALTIME_DATAFILE" VALUE
= "data.html">
<PARAM NAME = "SERIE_DATA_2" VALUE
= "-10|41|48|39|36|34|50">
<PARAM NAME = "CHART_BORDER" VALUE = "0.2|BLACK|LINE">
<PARAM NAME = "CHART_FILL" VALUE = "0xffcc00">
<PARAM NAME = "BIG_TICK_INTERVALX" VALUE = "1">
<PARAM NAME = "BIG_TICK_INTERVALY" VALUE = "1">
<PARAM NAME = "YSCALE_MIN" VALUE = "-15">
<PARAM NAME = "XSCALE_MIN" VALUE = "0">
<PARAM NAME = "XSCALE_MAX" VALUE = "7">
<PARAM NAME = "YAXIS_AUTO_TICKS" VALUE
= "7">
<PARAM NAME = "LEGEND_BORDER" VALUE =
"0.2|BLACK|LINE">
<PARAM NAME = "LEGEND_FILL" VALUE = "WHITE">
<PARAM NAME = "SERIE_BORDER_TYPE_1" VALUE = "RAISED">
<PARAM NAME = "SERIE_BORDER_TYPE_2" VALUE = "RAISED">
<PARAM NAME = "BARCHART_BARSPACE" VALUE = "1">
</APPLET>
</BODY>
</HTML>
- Copy rchart.jar to the same directory as realtime.html
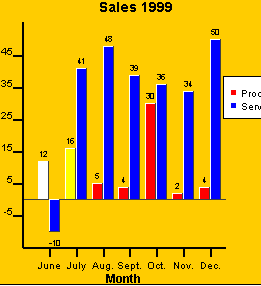
- Create a file called "data.html" that contains: SERIE_DATA_1=10|16|5|4|30|2|4
- Open now realtime.html with your browser, the result will be:
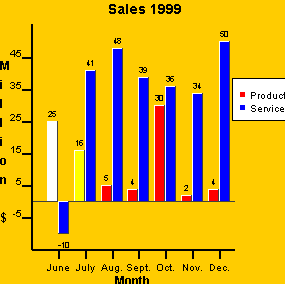
- Change now the content of data.html like this: SERIE_DATA_1=25|16|5|4|30|2|4
- After a maximum of 2 seconds the result will be:
Javascript
integration
You may also use javascript to change the chart displayed in the applet. The
applet has the following methods:
- setParameter(String param,String value): sets a parameter. Call rebuild
to apply changes.
- loadFromFile(String psFile,String Clear): load a definition file. Clear
can be 'N' or 'Y'. If 'N', the new parameters will be added to the previous
set parameters. If 'Y' the chart will be completelly reset.
- rebuild(String Clear,String reReadFile): Repaints the chart . Clear can
be 'N' or 'Y'. If 'N', the new parameters will be added to the previous set
parameters. If 'Y' the chart will be completelly reset. reReadFile can be
'N' or 'Y'. It specifies wheter the file in the DATAFILE parameter should
be reread.
For example, to change the line's style of the second serie of a chart you can
use the following JavaScript function:
function changeStyle() {
document.TestApplet.setParameter('SERIE_STYLE_2','2|GREEN|DASHED');
document.TestApplet.rebuild('N','N');
}
See file chart1.hml in the evaluation version for a complete example.
RChart (only the applet) will trigger the OnClickRChart event when the
user clicks on bar (barchart), point (linechart) or item (piechart). In order
to activate this feature you must set the parameter
CHART_JAVASCRIPT_EVENTS=True
This event will receive two parameters:
- name of the serie the user clicked on.
- secuence of the point/bar/item the user cliked on (starting at 0).
For example:
<SCRIPT>
function OnClickRChart(serieName, valuePosition) {
}
</SCRIPT>
Note that you must also include the word MAYSCRIPT in the applet parameters.
ASP
The following example will
create an area chart (it is very similar to the example Chart2.htm).
It will retrieve the data
from an MSAccess database that contains a table called "salesMonth".
This table has three fields: "Products" (integer), "Services"
(integer) and "salesMonth" (date), which contains the sales for several
months.
The example will display
the sales of the last 6 months. It will create a HTML page that contains the
applet. Most of the parameters of the applet are constant, however the date
labels and the sales data is retrieved from the DB.
<%@ LANGUAGE="VBSCRIPT"
%>
<%'
variables used to store the data used as parameter for the applet
dim labels, values1,values2
%>
<HTML>
<HEAD> </HEAD>
<BODY>
<APPLET
CODEBASE = "."
CODE = "com.java4less.rchart.ChartApplet.class"
NAME = "TestApplet"
WIDTH = 500 HEIGHT = 500
>
<!--
**** VARIABLE DATA, use VBScript to retrieve series data values from database
**** -->
<%
' get data from last 6 months
set Connect=Server.CreateObject("ADODB.Connection")
' open db
using a System ODBC data source called "Data"
Connect.ConnectionString="DSN=data;"
Connect.Open
' get sales
data, execute SQL
set rs=Connect.Execute("Select * from SalesMonth Order by salesMonth
DESC")
i=1
values1=""
values2=""
labels=""
' loop,
plot only last 6 months
while (not rs.eof) and (i<=6)
if (i>1) then
' add separators to create list of values
values1= "|" & values1
values2= "|" & values2
labels= "|" & labels
end if
' get month name
labels= "" & MonthName(DatePart("m",rs("salesMonth")),1)
& labels
' get sales of products
values1= "" & rs("Product") & values1
' get sales of services
values2= "" & rs("Services") & values2
i=i+1
rs.movenext
wend
rs.close
Connect.close
set Connect=nothing
%>
<!--
**** output of calculated variables**** -->
<PARAM NAME = "XAXIS_LABELS" VALUE = "<%=labels%>">
<PARAM NAME = "SERIE_DATA_2" VALUE = "<%=values1%>">
<PARAM NAME = "SERIE_DATA_1" VALUE = "<%=values2%>">
<!-- **** CONSTANT DATA **** -->
<PARAM
NAME = "TITLECHART" VALUE = "Sales 1999">
<PARAM NAME = "LEGEND" VALUE = "TRUE">
<PARAM NAME = "XLABEL" VALUE = "Month">
<PARAM NAME = "YLABEL" VALUE = "Million $">
<PARAM NAME = "SERIE_1" VALUE = "Products">
<PARAM NAME = "SERIE_2" VALUE = "Services">
<PARAM NAME = "SERIE_STYLE_1" VALUE = "0.2|0x663300|LINE">
<PARAM NAME = "SERIE_STYLE_2" VALUE = "0.2|0x99|LINE">
<PARAM NAME = "SERIE_FILL_1" VALUE = "RED">
<PARAM NAME = "SERIE_FILL_2" VALUE = "0x99cc">
<PARAM NAME = "SERIE_FONT_1" VALUE = "Arial|PLAIN|8">
<PARAM NAME = "SERIE_FONT_2" VALUE = "Arial|PLAIN|8">
<PARAM NAME = "SERIE_POINT_1" VALUE = "true">
<PARAM NAME = "SERIE_POINT_2" VALUE = "true">
<PARAM NAME = "SERIE_TYPE_1" VALUE = "LINE">
<PARAM NAME = "SERIE_TYPE_2" VALUE = "LINE">
<PARAM NAME = "CHART_BORDER" VALUE = "0.2|BLACK|LINE">
<PARAM NAME = "CHART_FILL" VALUE = "LIGHTGRAY">
<PARAM NAME = "BIG_TICK_INTERVALX" VALUE = "1">
<PARAM NAME = "BIG_TICK_INTERVALY" VALUE = "1">
<PARAM NAME = "YSCALE_MIN" VALUE = "0">
<PARAM NAME = "TICK_INTERVALY" VALUE = "100">
<PARAM NAME = "LEGEND_BORDER" VALUE = "0.2|BLACK|LINE">
<PARAM NAME = "LEGEND_FILL" VALUE = "WHITE">
<PARAM NAME = "XAXIS_TICKATBASE" VALUE = "true">
<PARAM NAME = "XAXIS_TICKATBASE" VALUE = "true">
<PARAM NAME = "BACK_IMAGE" VALUE = "back13.gif">
</APPLET>
</BODY>
</HTML>
JSP[TM]
The following example will
create an area chart (it is very similar to the example Chart2.htm).
It will retrieve the data
from an MSAccess database that contains a table called "salesMonth".
This table has three fields: "Products" (integer), "Services"
(integer) and "salesMonth" (date), which contains the sales for several
months.
The example will display
the sales of the last 6 months. It will create a HTML page that contains the
applet. Most of the parameters of the applet are constant, however the date
labels and the sales data is retrieved from the DB.
<HTML>
<HEAD></HEAD>
<BODY>
<APPLET
CODEBASE = "."
CODE = "com.java4less.rchart.ChartApplet.class"
NAME = "TestApplet"
ARCHIVE = "rchartClasses.zip"
WIDTH = 500 HEIGHT = 500>
<!--
**** VARIABLE DATA, use Java[TM] code to retrieve series data values from database
**** -->
<%
java.sql.Statement st;
java.sql.ResultSet rs;
java.sql.Connection db=null;
int i=1;
String labels="";
String values1="";
String values2="";
// connect
to database
// open db using a System ODBC data source called "Data"
try {
Class.forName("sun.jdbc.odbc.JdbcOdbcDriver");
db = java.sql.DriverManager.getConnection("jdbc:odbc:data",
"", "");
}
catch(Exception e) {
System.err.println("Error eonnecting to DB:" + e.getMessage());
}
try {
st = db.createStatement();
/*get sales data, execute SQL*/
rs = st.executeQuery("Select * from SalesMonth Order by salesMonth
DESC");
/* iterate
on sales data, up to 6 rows */
while ((i <= 6) && (rs.next())) {
/* concatenate | separator */
if (i>1) {
values1= "|" + values1;
values2= "|" + values2;
labels= "|" + labels;
}
/* concatenate
value */
values1= "" + rs.getString("Services") + values1;
values2= "" + rs.getString( "Product") + values2;
java.text.SimpleDateFormat df= new java.text.SimpleDateFormat("MMM");
labels= "" + df.format(rs.getDate("salesMonth")) +
labels;
i++;
}
rs.close();
db.close();
}
catch(Exception
e) {
System.err.println("Error:" + e.getMessage());}
/* echo values
for serie 1 */
out.println("<PARAM NAME = \"SERIE_DATA_1\" VALUE =
\"" + values1 + "\">");
/* echo values
for serie 2 */
out.println("<PARAM NAME = \"SERIE_DATA_2\" VALUE =
\""+ values2 + "\">");
/* echo values
for labels */
out.println("<PARAM NAME = \"XAXIS_LABELS\" VALUE =
\""+ labels + "\">");
%>
<!-- **** CONSTANT DATA **** -->
<PARAM NAME = "TITLECHART" VALUE = "Sales 1999">
<PARAM NAME = "LEGEND" VALUE = "TRUE">
<PARAM NAME = "XLABEL" VALUE = "Month">
<PARAM NAME = "YLABEL" VALUE = "Million $">
<PARAM NAME = "SERIE_1" VALUE = "Services">
<PARAM NAME = "SERIE_2" VALUE = "Products">
<PARAM NAME = "SERIE_STYLE_1" VALUE = "0.2|0x663300|LINE">
<PARAM NAME = "SERIE_STYLE_2" VALUE = "0.2|0x99|LINE">
<PARAM NAME = "SERIE_FILL_1" VALUE = "RED">
<PARAM NAME = "SERIE_FILL_2" VALUE = "0x99cc">
<PARAM NAME = "SERIE_FONT_1" VALUE = "Arial|PLAIN|8">
<PARAM NAME = "SERIE_FONT_2" VALUE = "Arial|PLAIN|8">
<PARAM NAME = "SERIE_POINT_1" VALUE = "true">
<PARAM NAME = "SERIE_POINT_2" VALUE = "true">
<PARAM NAME = "SERIE_TYPE_1" VALUE = "LINE">
<PARAM NAME = "SERIE_TYPE_2" VALUE = "LINE">
<PARAM NAME = "CHART_BORDER" VALUE = "0.2|BLACK|LINE">
<PARAM NAME = "CHART_FILL" VALUE = "LIGHTGRAY">
<PARAM NAME = "BIG_TICK_INTERVALX" VALUE = "1">
<PARAM NAME = "BIG_TICK_INTERVALY" VALUE = "1">
<PARAM NAME = "YSCALE_MIN" VALUE = "0">
<PARAM NAME = "TICK_INTERVALY" VALUE = "100">
<PARAM NAME = "LEGEND_BORDER" VALUE = "0.2|BLACK|LINE">
<PARAM NAME = "LEGEND_FILL" VALUE = "WHITE">
<PARAM NAME = "XAXIS_TICKATBASE" VALUE = "true">
<PARAM NAME = "XAXIS_TICKATBASE" VALUE = "true">
<PARAM NAME = "BACK_IMAGE" VALUE = "back13.gif">
</APPLET>
</BODY>
</HTML>
Php
The following example will
create an area chart (it is very similar to the example Chart2.htm).
It will retrieve the data
from an MSAccess database that contains a table called "salesMonth".
This table has three fields: "Products" (integer), "Services"
(integer) and "salesMonth" (date), which contains the sales for several
months.
The example will display
the sales of the last 6 months. It will create a HTML page that contains the
applet. Most of the parameters of the applet are constant, however the date
labels and the sales data is retrieved from the DB.
<HTML>
<HEAD></HEAD>
<BODY>
<APPLET
CODEBASE = "."
CODE = "com.java4less.rchart.ChartApplet.class"
NAME = "TestApplet"
WIDTH = 500 HEIGHT = 500 ALIGN = middle
>
<!--
**** VARIABLE DATA, use Php to retrieve series data values from database
****
-->
<?
$labels="";
$values2="";
$values1="";
$i=1;
/* connect
to database
open db using a System ODBC data source called "Data" */
$odbcid = odbc_connect ("data", "", "",
"");
/*
get sales
data, execute SQL*/
$resultid = odbc_exec ($odbcid, "Select * from SalesMonth Order by
salesMonth DESC") ;
/* iterate on sales data, up to 6 rows */
while (($i <= 6) and (odbc_fetch_row($resultid))) {
/* concatenate | separator */
if ($i>1) {
$values1= "|" . $values1;
$values2= "|" . $values2;
$labels= "|" . $labels;
}
/* concatenate
value */
$values1= odbc_result ($resultid, "Services") . $values1;
$values2= odbc_result ($resultid, "Product") . $values2;
$labels= odbc_result ($resultid, "salesMonth") . $labels;
$i=$i+1;
/* next record */
odbc_fetch_row($resultid);
}
/* echo values for serie 1 */
echo "<PARAM NAME = \"SERIE_DATA_1\" VALUE = \"";
echo $values1;
echo "\">";
/* echo
values for serie 2 */
echo "<PARAM NAME = \"SERIE_DATA_2\" VALUE = \"";
echo $values2;
echo "\">";
/* echo
values for labels */
echo "<PARAM NAME = \"XAXIS_LABELS\" VALUE = \"";
echo $labels;
echo "\">";
/* close
result */
odbc_free_result($resultid);
/* close connection */
odbc_close($odbcid);
?>
<!-- **** CONSTANT DATA **** -->
<PARAM
NAME = "TITLECHART" VALUE = "Sales 1999">
<PARAM NAME = "LEGEND" VALUE = "TRUE">
<PARAM NAME = "XLABEL" VALUE = "Month">
<PARAM NAME = "YLABEL" VALUE = "Million $">
<PARAM NAME = "SERIE_1" VALUE = "Services">
<PARAM NAME = "SERIE_2" VALUE = "Products">
<PARAM NAME = "SERIE_STYLE_1" VALUE = "0.2|0x663300|LINE">
<PARAM NAME = "SERIE_STYLE_2" VALUE = "0.2|0x99|LINE">
<PARAM NAME = "SERIE_FILL_1" VALUE = "RED">
<PARAM NAME = "SERIE_FILL_2" VALUE = "0x99cc">
<PARAM NAME = "SERIE_FONT_1" VALUE = "Arial|PLAIN|8">
<PARAM NAME = "SERIE_FONT_2" VALUE = "Arial|PLAIN|8">
<PARAM NAME = "SERIE_POINT_1" VALUE = "true">
<PARAM NAME = "SERIE_POINT_2" VALUE = "true">
<PARAM NAME = "SERIE_TYPE_1" VALUE = "LINE">
<PARAM NAME = "SERIE_TYPE_2" VALUE = "LINE">
<PARAM NAME = "CHART_BORDER" VALUE = "0.2|BLACK|LINE">
<PARAM NAME = "CHART_FILL" VALUE = "LIGHTGRAY">
<PARAM NAME = "BIG_TICK_INTERVALX" VALUE = "1">
<PARAM NAME = "BIG_TICK_INTERVALY" VALUE = "1">
<PARAM NAME = "YSCALE_MIN" VALUE = "0">
<PARAM NAME = "TICK_INTERVALY" VALUE = "100">
<PARAM NAME = "LEGEND_BORDER" VALUE = "0.2|BLACK|LINE">
<PARAM NAME = "LEGEND_FILL" VALUE = "WHITE">
<PARAM NAME = "XAXIS_TICKATBASE" VALUE = "true">
<PARAM NAME = "XAXIS_TICKATBASE" VALUE = "true">
<PARAM NAME = "BACK_IMAGE" VALUE = "back13.gif">
</APPLET>
</BODY>
</HTML>