RCHART TUTORIAL, Chapter 5

Copyright 2003, J4L Components (http://www.java4less.com)
Go bak to contents


Barchart configuration / parameters

Bar and column chart

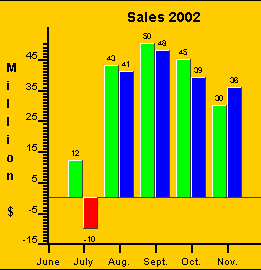
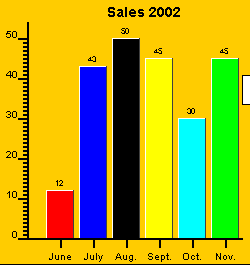
If you want to create barchart you must use SERIE_TYPE_*=BAR (or BarPlotter class). The following is a complete example of a barchart with 2 series and negative values:

Parameters
Description
Equivalent Java[TM] class/property

TITLECHART=Sales 2002
XLABEL=Month
YLABEL=Million $
XSCALE_MIN=0
XSCALE_MAX=5.5
YSCALE_MIN=-15
BIG_TICK_INTERVALX=1 BIG_TICK_INTERVALY=10 XAXIS_LABELS=June|July|Aug.|Sept.|Oct.|Nov.|Dec. CERO_XAXIS=LINE
YAXIS_INTEGER=TRUE
SERIE_1=Products
SERIE_2=Services
SERIE_TYPE_1=BAR
SERIE_TYPE_2=BAR SERIE_FONT_1=Arial|PLAIN|8 SERIE_FONT_2=Arial|PLAIN|8 SERIE_DATA_1=12|43|50|45|30
SERIE_DATA_2=-10|41|48|39|36 SERIE_BORDER_TYPE_1=RAISED SERIE_BORDER_TYPE_2=RAISED SERIE_BAR_STYLE_1=0xff00 SERIE_BAR_STYLE_2=0xff BARCHART_BARSPACE=1
LEFT_MARGIN=0.15
CHART_FILL=0xffcc00
SERIE_NEGATIVE_STYLE_2=RED

Title and labels


X scale is 0-5.5

Y scale starts at -15


X axis labels
Draw line at possition 0 of Y Axis
Do not use decimal in the scale


Select barchart type

Font of the values above the bars

Values of the bars

Bars should have "raised" effect

Color of the bars


Background color of the chart
Negative bars have red color

new Title("Sales 2002");
chart.XLabel=new HAxisLabel("Month",Color,font);
chart.YLabel=new VAxisLabel("Million $",Color,font);
chart.XAxis.scale.min=0;
chart.XAxis.scale.max=5.5;
chart.YAxis.scale.min=-15;
chart.XAxis.bigTickInterval=1;

chart.XAxis.tickLabels{"June",...};
chart.XAxis.ceroAxis=Axis.CEROAXIS_LINE;
chart.YAxis.IntegerScale=true;
legend.addItem("Products",style);

serie1=new BarDataSerie(values,fillStyle);

serie1.valueFont=new Font(...);

see values in BarDataSerie constructor

serie.borderType=BarDataSerie.BORDER_RAISED;

see style in BarDataSerie constructor

barPlotter.interBarSpace=1;
chart.leftMargin=0.15;

serie2.negativeStyle=new FillStyle(Color.red);


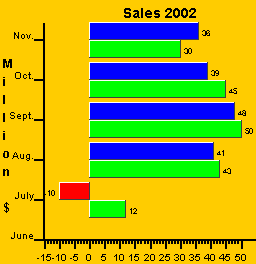
By changing the following parameters you can convert it to a horizontal barchart:

Parameters
Description
Equivalent Java[TM] class/property

BARCHART_VERTICAL=FALSE XSCALE_MIN=-15
BIG_TICK_INTERVALY=1
YAXIS_LABELS=June|July|Aug.|Sept.|Oct.|Nov.|Dec.
XAXIS_START_WITH_BIG_TICK=TRUE
XAXIS_INTEGER=TRUE

Horizontal bars
Definition of the scales/axis
Only big ticks (no small ticks)
Labels for the scale
There should be a big tick at possition 0

barPlotter.verticalBar
chart.XAxis.scale.min=-15;
chart.YAxis.bigTickIntervalList=1;
chart.YAxis.tickLabels{"June",...};
chart.XAxis.startWithBigTick=true;
chart.XAxis.IntegerScale=true;


Bars can also be forced to start at a fixed possition instead of the default, which is 0.

Parameters
Description
Equivalent Java[TM] class/property

BARCHART_BASE=5

Starting possition of bars

barPlotter.barsBase=5;


You can also assign a different color to each bar in your series.

Parameters
Description
Equivalent Java[TM] class/property

SERIE_BARS_COLORS_1=RED|BLUE|BLACK|YELLOW|CYAN

Colors of the bars

serie1.barStyles=styles;


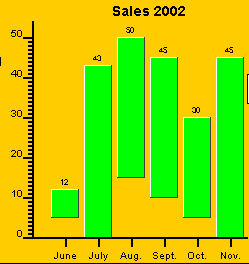
Each bar can also start at a different possition by means of the SERIE_BARS_START_ parameter .

Parameters
Description
Equivalent Java[TM] class/property

SERIE_DATA_1=12|43|50|45|30|45
SERIE_BARS_START_1=5|0|15|10|5

End possition of the bars.
Start possition of the bars.

see values in BarDataSerie constructor
serie1.addBarsBase (startValues);


The following parameters will allow you to control the width:

The main parameter is BARCHART_BARWIDTH

Parameters
Description
Equivalent Java[TM] class/property

BARCHART_BARWIDTH=4

Bar's width

barPlotter.barWidth=4;

this parameter has priority over the other parameters.

If you don't want to specify the width of the bars you can also specify the distance between bars and the distance between groups of bars:

Parameters
Description
Equivalent Java[TM] class/property

BARCHART_BARSPACE=4

space between bars

barPlotter.interBarSpace=4;


if you have only 2 bars you can end up with the right bar overlapping the legend:

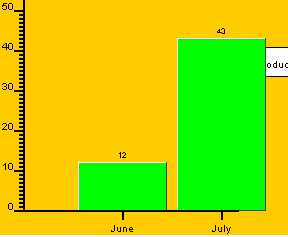
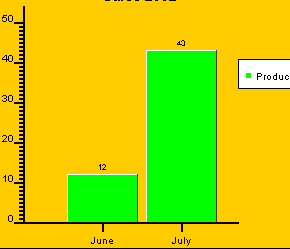
you can solve this problem by adding 0.5 to the maximum value of the scale. In the example:

Parameters
Description
Equivalent Java[TM] class/property

XSCALE_MAX=2.5

Make the X axis a bit longer then required so that it looks better.

chart.XAxis.scale.max=2.5;


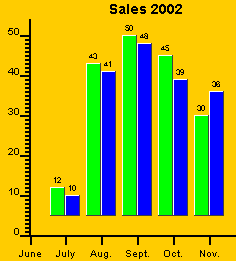
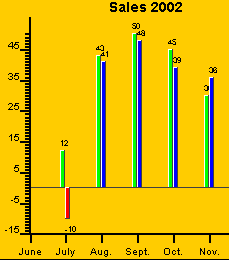
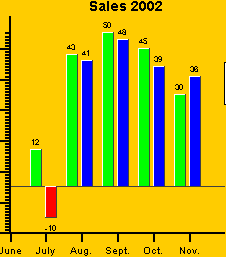
There is avery common error which result is getting the following chart:

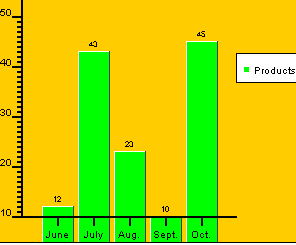
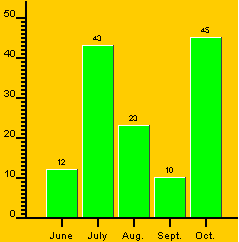
which can be solved by setting the correct value for the Y scale:

Parameters
Description
Equivalent Java[TM] class/property

YSCALE_MIN=0

Starting point of the Y scale.

chart.YAxis.scale.min=0;


Stackbar chart

If you want the values of the series to be added (stackbar) then you must set BARCHART_CUMULATIVE=TRUE like in the following example:

Parameters
Description
Equivalent Java[TM] class/property

BARCHART_CUMULATIVE=TRUE
SERIE_DATA_1=12|43|50|45|30
SERIE_DATA_2=10|41|48|39|36
SERIE_TYPE_1=BAR
SERIE_TYPE_2=BAR

Activate stackbar chart
Values

Barchart

barPlotter.cumulative
see values in BarDataSerie constructor


Eventchart

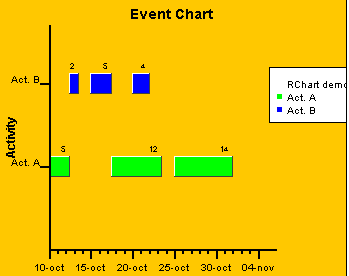
Eventcharts have the following properties:

  1. All values in the serie are aligned in the same line (SERIE_DATAX_ parameter).
  2. Each value is made of a starting point and an ending point (SERIE_BARS_START_ and SERIE_DATA_)

In this way the chart can represent length of activities.

Parameters
Description
Equivalent Java[TM] class/property

SERIE_BARS_START_1=0|15|30
SERIE_DATA_1=5|27|44
SERIE_DATAX_1=0|0|0
SERIE_BARS_START_2=5|10|20
SERIE_DATA_2=7|15|24 SERIE_DATAX_2=1|1|1 BARCHART_VERTICAL=false BARCHART_EVENTCHART=true

Starting possitions of bars (serie 1)
Ending possitions of bars (serie 1)
bars centered on first tick (Act A)
Starting possitions of bars (serie 2)
Ending possitions of bars (serie 2)
bars centered on second tick (Act B)
Horizontal bars
event chart (bars centered on tick)

serie1.addBarsBase (startValues);
see values in BarDataSerie constructor
serie1.setDatax(...);


barPlotter.eventChart=true;


Barchart 3D


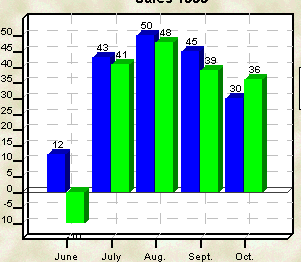
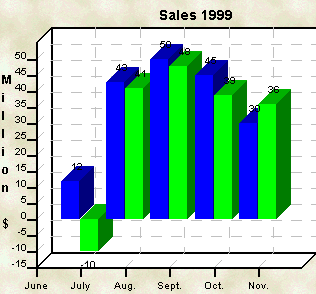
If you want to create 3D barchart you must use SERIE_TYPE_*=BAR3D (or BarPlotter3D class). The following is a complete example:

Parameters
Description
Equivalent Java[TM] class/property

TITLECHART=Sales 1999
XLABEL=Month
YLABEL=Million $
XSCALE_MIN=0
YSCALE_MIN=-15
XSCALE_MAX=5.5
TICK_INTERVALY=5
BIG_TICK_INTERVALX=1
BIG_TICK_INTERVALY=1
XAXIS_GRID=0.2|0xc0c0c0|DASHED
XAXIS_LABELS=June|July|Aug.|Sept.|Oct.|Nov.|Dec.
YAXIS_INTEGER=TRUE
LEGEND_FILL=WHITE
LEGEND_BORDER=0.2|0x0|NORMAL
SERIE_1=Products
SERIE_2=Services
SERIE_TYPE_1=BAR3D
SERIE_TYPE_2=BAR3D
SERIE_DATA_1=12|43|50|45|30
SERIE_DATA_2=-10|41|48|39|36
SERIE_BAR_STYLE_2=0xff00
BARCHART_BARSPACE=1
BARCHART3D_DEPTH=15
BARCHART3D_FULL_DEPTH=TRUE
BARCHART3D_BACK=WHITE
CHART_BORDER=0.2|0x0|NORMAL
CHART_FILL=LIGHTGRAY
BACK_IMAGE=back13.gif

Title and labels

X scale is 0-5.5
Y scale starts at -15


Activate grid

X axis labels
Do not use decimal in the scale


Select barchart 3D type

Values of the bars


Color of the bar

Length of Z axis


Background image

new Title("Sales 1999");
chart.XLabel=new HAxisLabel("Month",Color,font);
chart.YLabel=new VAxisLabel("Million $",Color,font);
chart.XAxis.scale.min=0;
chart.YAxis.scale.min=-15;
chart.XAxis.scale.max=5.5;
chart.YAxis.scaleTickInterval=5; chart.XAxis.bigTickInterval=1;

chart.XAxis.gridStyle=new LineStyle(...);

chart.XAxis.tickLabels{"June",...}; chart.YAxis.IntegerScale=true;
legend.background=new FillStyle(Color.white);

legend.addItem("Products",style);

serie1=new BarDataSerie(values,fillStyle);

see values in BarDataSerie constructor

see style in BarDataSerie constructor
barPlotter3D.interBarSpace=1;
barPlotter3D.depth=15;
barPlotter3D.fullDepth=true;
barPlotter3D.back=new FillStyle(Color.white);


chart.backImage=image;

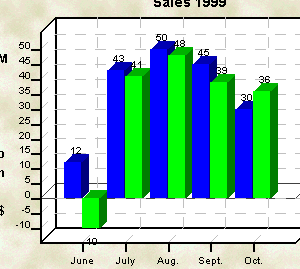
All parameters are the same as in the 2D barcharts. The following parameter are 3D barchart specific:

the following parameter controls the depth of the bars:

Parameters
Description
Equivalent Java[TM] class/property

BARCHART3D_FULL_DEPTH=false

Bars should not be as deep as the Z axis. In this case the depth of the bars will be the length of the Z axis / 2.

barPlotter3D.fullDepth=false;

You can specify the length of the Z axis with:

Parameters
Description
Equivalent Java[TM] class/property

BARCHART3D_DEPTH=5

Change length of the Z axis (pixels)

barPlotter3D.depth=5;