Copyright 2003, J4L
Components (http://www.java4less.com)
Go bak to contents
RChart supports 3 axis, a horizontal axis (X) at the bottom of the chart, and 2 vertical axis to the left (Y) and to the right (Y2) of the chart.
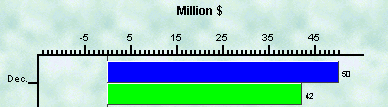
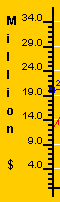
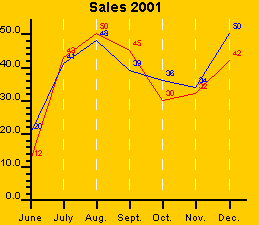
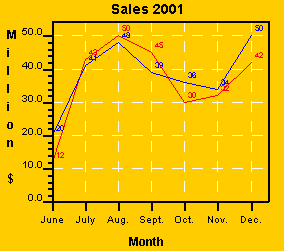
Each Axis can have an associate label. The label of the following example is "Million $":
The properties of the label are:
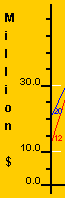
The following example paints a blue vertical label with "Serif" font:
|
Parameters
|
Description
|
Equivalent Java[TM] class/property
|
|
YLABEL=Million $ |
Text of label |
chart.YLabel=new VAxisLabel("Million",color,font); |
RChart supports 2 kind of ticks:
There are 2 ways you can control the number and position of the ticks in the scale:
Manual: You can use the following parameters to define the spacing between ticks:
the default values are:
|
Parameters
|
Description
|
Equivalent Java[TM] class/property
|
|
TICK_INTERVALY=1 |
Small ticks for each unit of the scale |
yAxis.scaleTickInterval=1; |
![]()
an example is:
|
Parameters
|
Description
|
Equivalent Java[TM] class/property
|
|
TICK_INTERVALY=2 |
the result will be one big tick after 20 unit
(2*10) |
yAxis.scaleTickInterval=2; |
![]()
Automatic: you can also let RChart calculate the value for the tick interval using the following parameters:
VALUE="0.1|0.5|1|5|10|25|50|100|250|500|1000|5000|10000|50000|100000|500000|1000000"
For example, if your values range from 0 till 300 and the desired number of ticks is 10. RChart will select tick_interval=25 which will result in 12 ticks. See screenshot.
Other ticks parameters
|
Parameters
|
Description
|
Equivalent Java[TM] class/property
|
|
YAXIS_START_WITH_BIG_TICK=false |
First tick should be small |
chart.YAxis.startWithBigTick=false; |
|
Parameters
|
Description
|
Equivalent Java[TM] class/property
|
|
YAXIS_START_WITH_BIG_TICK=false |
First tick should be small |
chart.YAxis.startWithBigTick=false; |
If you don't want to have small ticks you can set BIG_TICK_INTERVALY=1. For example:
|
Parameters
|
Description
|
Equivalent Java[TM] class/property
|
|
TICK_INTERVALY=5 |
One tick every 5 units |
chart.YAxis.scaleTickInterval=5; |
![]()
Ticks at irregular interval
The tick interval parameters allows you to define the position of the ticks. These are displayed at fixed intervals only. You can also use the BIG_TICK_INTERVAL_LISTY parameter to define the positions where the big ticks should appear. For example:
|
Parameters
|
Description
|
Equivalent Java[TM] class/property
|
|
TICK_INTERVALY=5 |
One tick every 5 units |
chart.YAxis.scaleTickInterval=5; |
The following parameters allow you to control the length of the ticks. For example, you can remove the small ticks by making its length=0:
|
Parameters
|
Description
|
Equivalent Java[TM] class/property
|
|
YAXIS_TICKPIXELS=0 |
Length of small ticks (0, invisible) |
chart.YAxis.tickPixels=0; |
![]()
Labels are always displayed at the big ticks positions. The following parameters allow you to modify the labels.
XAXIS_LABEL_FORMAT. If XAXIS_INTEGER is false, this format will be used to draw the label. For example "#####.00" will always display 2 decimal digits. The format uses the following symbols:
|
Parameters
|
Description
|
Equivalent Java[TM] class/property
|
|
YAXIS_LABEL_FORMAT=#0.0 |
Use only 1 decimal digit in the tick labels |
chart.YAxis.scaleLabelFormat; |
![]()
The following parameter will remove the digits right of the decimal separator:
|
Parameters
|
Description
|
Equivalent Java[TM] class/property
|
|
YAXIS_INTEGER=true |
Do not use decimal values in labels of the ticks. |
chart.YAxis.IntegerScale=true |
|
Parameters
|
Description
|
Equivalent Java[TM] class/property
|
|
YAXIS_LABELS=cero|one|two|three|four|five |
User defined labels for the big ticks. |
chart.YAxis.tickLabels={"cero","one",....}; |
![]()
You can split your labels in sereval lines by using "\n".
|
Parameters
|
Description
|
Equivalent Java[TM] class/property
|
|
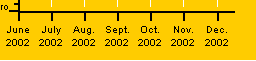
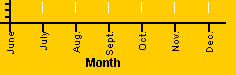
XAXIS_VERTICAL_LABELS=false. XAXIS_LABELS=June\n2002|July\n2002|Aug.\n2002|
|
If "true" the labels will be painted
with a 90 degrees rotation. |
chart.XAxis.verticalLabels; |
or paint labels vertically:
|
Parameters
|
Description
|
Equivalent Java[TM] class/property
|
|
XAXIS_VERTICAL_LABELS=TRUE |
Rotate labels |
chart.tmpImage=new BufferedImage(200,200,...); |
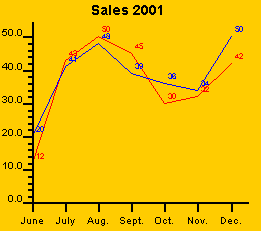
RChart will by default no display a grid:
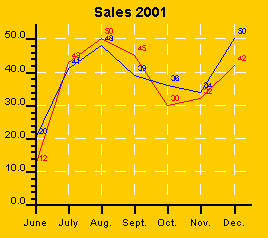
however you can add the grid with the following parameters:
|
Parameters
|
Description
|
Equivalent Java[TM] class/property
|
|
XAXIS_GRID=0.2|0xffffff|DASHED
|
Line style of the grid |
chart.XAxis.gridStyle; |
which let you define the style of the line used for the grid lines.
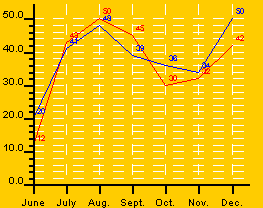
If you want to get a finer grid you can display the grid at the small tick positions with:
|
Parameters
|
Description
|
Equivalent Java[TM] class/property
|
|
XAXIS_GRID=0.2|0xffffff|DASHED
|
Line style of the grid |
chart.XAxis.gridStyle; |
You can of course display lines for 1 axis only, for example:
|
Parameters
|
Description
|
Equivalent Java[TM] class/property
|
|
XAXIS_GRID=0.2|0xffffff|DASHED
|
Only vertical grid |
chart.XAxis.gridStyle; |
If you scale's minimum value is less than cero, you might want to paint a line at the cero possition to be used as reference by the user.
|
Parameters
|
Description
|
Equivalent Java[TM] class/property
|
|
CERO_XAXIS=LINE |
Draw line at Y axis, possition 0 |
chart.XAxis.ceroAxis=Axis.CEROAXIS_LINE; |
You can also define the cero axis to include the ticks (the labels are still painted at the bottom of the chart).
|
Parameters
|
Description
|
Equivalent Java[TM] class/property
|
|
CERO_XAXIS=SCALE |
Draw scale at Y axis position 0 |
chart.XAxis.ceroAxis=Axis.CEROAXIS_SCALE |
The following parameters allows you create a "frame" around the chart.
|
Parameters
|
Description
|
Equivalent Java[TM] class/property
|
|
XAXIS_CLOSED=TRUE |
draw lines at the top and on right of the chart to get a closed box. |
chart.XAxis.axisFrame=true; |
You can also use dates as labels for the ticks with the following parameters:
|
Parameters
|
Description
|
Equivalent Java[TM] class/property
|
|
BIG_TICK_INTERVALX=2 |
Ticks Interval |
chart.YAxis.bigTickInterval; |
will result in the following secuence of ticks/labels
- big tick, label "01-Jan-01"
- small tick, no label
- big tick, label "03-Jan-01"
- small tick, no label
- big tick, label "05-Jan-01"
- .....
Example 1:
|
Parameters
|
Description
|
Equivalent Java[TM] class/property
|
|
XAXIS_DATE_FORMAT=MMM |
Format of the date (only month name) |
chart.YAxis.dateLabelFormat; |
![]()
Example 2:
|
Parameters
|
Description
|
Equivalent Java[TM] class/property
|
|
XAXIS_DATE_FORMAT=dd-MMM |
Format of the date |
chart.YAxis.dateLabelFormat; |
![]()
Example 3:
|
Parameters
|
Description
|
Equivalent Java[TM] class/property
|
|
XAXIS_DATE_FORMAT=HH:mm |
Format of the date |
chart.YAxis.dateLabelFormat; |
![]()
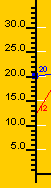
In order to activate the second Y axis you must use:
Y2AXIS =true
then you can define which data serie will use the scale of the second axis (serie 2 is the blue line)
|
Parameters
|
Description
|
Equivalent Java[TM] class/property
|
|
Y2AXIS =true |
Activate second/right Y axis |
chart.setY2Scale(cY2Axis); |

The following three parameters define the color and style of the axis
|
Parameters
|
Description
|
Equivalent Java[TM] class/property
|
|
YAXIS_STYLE=2|0xff|NORMAL |
Style of the axis |
chart.YAxis.style; |
![]()
If you want to place the x scale on the top of the chart, instead of on the bottom you can use the following parameters:
|
Parameters
|
Description
|
Equivalent Java[TM] class/property
|
|
XAXIS_ON_TOP=TRUE |
Place it on top |
chart.XAxis.scaleOnTop; |
Note that this is not supported for 3D charts.