Copyright 2005, J4L
Components (http://www.java4less.com)
Go bak to contents
The following section describes how the maximum and minimum values of the scale are calculated. The examples refer to the Y-Axis, however the same parameters are also available for the X and Y2 axis.
If you want to plot the following values:
10, 41 , 48 , 39, 36 ,34 , 49
you can use the following way in order to calculate the maximum and minimum values of the axis:
![]()
|
Parameters
|
Description
|
Equivalent Php class/property
|
|
YSCALE_MIN=0 |
Minimum value of the scale |
$xaxis->scale->min |
the result will be:
![]()
|
Parameters
|
Description
|
Equivalent Php class/property
|
|
YSCALE_EXACT_MAX=true |
Take the min. and max. values from the list of preferred values. |
$yaxis->scale->exactMaxValue |
RChart will use one of the values from the list you provided. This list must be sorted in ascending order and RChart will always select the first value that meets the condition:
![]()
|
Parameters
|
Description
|
Equivalent Php class/property
|
|
YSCALE_MIN=0 |
Minimum is 0 |
$yaxis->scale->min |
![]()
the following additional parameters are needed for logarithmic scales:
Note: logarithmic scales do not accept negative values.
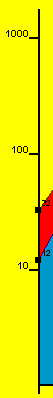
Example 1:
A base of 10 and tick Interval=0
means that the distance between 1 and 10 will be the same as the distance between
10 and 100, 100 and 1000 ...
|
Parameters
|
Description
|
Equivalent Php class/property
|
|
TICK_LOG_INTERVALY=true |
Ticks show not be placed at fixed intervals bu
using logaritmic scale. |
$yaxis->logarithmicIntervals=true; |
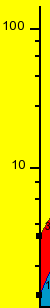
Example 2:
The default base is 2. This means, the distance between 1 and 2 will be the same as the distance between 2 and 4, 4 and 8..
|
Parameters
|
Description
|
Equivalent Php class/property
|
|
TICK_LOG_INTERVALY=true |
Ticks show not be placed at fixed intervals but
using logaritmic scale. |
$yaxis->logarithmicIntervals=true; |
![]()
Example 3:
The BIG_TICK_INTERVALY parameter allows you to add smal ticks:
BIG_TICK_INTERVALY=5
TICK_INTERVALY=0
 :
:
Example 4: If you set a
value larger than 0 for TICK_INTERVALY the ticks will be placed at 1, TICK_INTERVALY,
2*TICK_INTERVALY, 3*TICK_INTERVALY ..
BIG_TICK_INTERVALY=1
TICK_INTERVALY=20
![]()
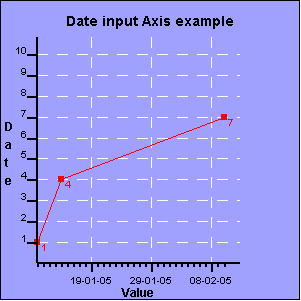
The following example shows a chart that has a date based X axis/scale. As you can see in the table below the SERIE_DATAX_1 parameter, we are providing the position of the values not as an integer value but as a date value (The same procedure could be used for the Y value using SERIE_DATA if you have a date based Y scale).
|
Parameters
|
Description
|
Equivalent php class/property
|
|
|
These are the parameters related to the date scale.
The rest of parameters required to create the chart are explained in other sections of this manual. |
Only available if the chartLoader and the parameters form the first column are used. |
The description of the parameters required to define a date (or time) based scale are:
The following example shows how to create a time based scale:
SERIE_DATAX_1=01/01/2005 1:20:00|01/01/2005 1:35:00|01/01/2005 1:45:00|01/01/2005
2:00:00
XAXIS_INITIAL_DATE=01-01-2005 00:00:00
XAXIS_FINAL_DATE=01-01-2005 03:00:00
XAXIS_DATE_STEP=n20
XAXIS_DATE_FORMAT=HH:mm
Note that the date "01-01-2005" is irrelevant since wer are only displaying the time value. The unit is 20 minutes (n20) between 00:00:00 and 03:00:00.