Copyright 2005, J4L
Components (http://www.java4less.com)
Go bak to contents
Tips are available in as a HTML image map. If are supported for lines (points), bars and pies.
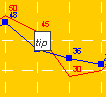
If you want to display tips when the mouse is placed over a bar, point or item you can use these parameters:
|
Parameters
|
Description
|
Equivalent c# class/property
|
|
CHART_SHOW_TIPS=TRUE |
Activate tips |
$loader=new ChartLoader();
|
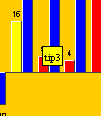
In the same way, you can also display tips in barcharts of in piecharts:
The tips and links features (described below) requires you to create not only a image for the chart but a html image map for the tips. The file getChart.php can create both items for you:
<?php
echo "<html>";
echo "<body>";
echo "<img src=\"http://localhost/chartphp/getChart.php?DATAFILE=http://localhost/test/barchart.txt&WIDTH=300&HEIGHT=300\" BORDER=0 ISMAP USEMAP=\"#CHART1\">";include "http://localhost/chartphp/getChart.php?DATAFILE=http://localhost/test/barchart.txt&WIDTH=300&HEIGHT=300&OUTPUT=imagemap&MAPNAME=CHART1";
echo "</body>";
echo "</html>";
?>
As you can see this php page will first create an image for the chart (see blue line) and it also creates the image map (see read line, note the OUTPUT parameter).
If you are using php code you can use the chartLoader class for creating the image map:
require("chartLoader.inc");
require("Chart.inc");
$g = new ChartGraphics;
$g->create(600,600);
$chartLoader->setParameter(...);
$chartLoader->setParameter(...);
....
$chart=& $chartLoader->buildChart();
$chart->setSize(600,600);
$chart->paint($g);
$imageMapStr=$chartLoader->getHTMLImageMap("CHART1");
RChart will open an URL when the user clicks on bar (barchart), point (linechart) or item (piechart). In order to activate this feature you must set the parameter: SERIE_LINKS_*.
For example, if your data series 1 has 3 values, you can set the parameter like this:
SERIE_LINKS_1=http://www.server.com/value1.html|http://www.server.com/value2.html|http://www.server.com/value3.html
Furthermore you can specify the frame where the HTML page will be displayed:
CHART_LINKS_TARGET=_new
Valid values are: "_new" (new browser's window) , "_top" (current window) and "<frame name>" (if you use frames).
[data.txt] this file contains the chart definition with html links:
TITLECHART=Sales 2003
XLABEL=Month
YLABEL=Million $
XSCALE_MAX=5.5
YSCALE_MIN=0
BARCHART_CUMULATIVE=false
SERIE_TIPS_1=12|43|50|45|30
CHART_SHOW_TIPS=true
SERIE_LINKS_2=http://www.java4less.com|http://www.java4less.com|http://www.java4less.com|http://www.java4less.com|http://www.java4less.com|http://www.java4less.com|http://www.java4less.com
BIG_TICK_INTERVALY=10
BIG_TICK_INTERVALX=1
YXAXIS_LABELS=June|July|Aug.|Sept.|Oct.|Nov.|Dec.
CERO_XAXIS=LINE
YAXIS_INTEGER=TRUE
SERIE_1=Products
SERIE_2=Services
SERIE_TYPE_1=BAR
SERIE_TYPE_2=BAR
SERIE_FONT_1=Arial|8
SERIE_FONT_2=Arial|8
SERIE_DATA_1=12|43|50|45|30
SERIE_DATA_2=10|41|48|39|36
SERIE_BORDER_TYPE_1=RAISED
SERIE_BORDER_TYPE_2=RAISED
SERIE_BAR_STYLE_1=#00FF00
SERIE_BAR_STYLE_2=#0000FF
LEFT_MARGIN=0.15
CHART_FILL=#FFCC00
SERIE_NEGATIVE_STYLE_2=RED
YLABEL_VERTICAL=TRUE
You can create drill down charts in the following way:
For example, the following php code will create a drilldown Pie chart:
<?php
echo "<html>";
echo "<body>";
// write IMG tag
echo "<img src=\"http://localhost/chartphp/getChart.php?DATAFILE=http://localhost/chartphp/examples/piechart.txt&WIDTH=300&HEIGHT=300\" BORDER=0 ISMAP USEMAP=\"#CHART1\">";
// write image map
include "http://localhost/chartphp/getChart.php?DATAFILE=http://localhost/chartphp/examples/piechart.txt&WIDTH=300&HEIGHT=300&OUTPUT=imagemap&MAPNAME=CHART1";echo "</body>";
echo "</html>";
?>
The content of the data file is:
[piechart.txt]
TITLECHART=Sales 2003
LEGEND=TRUE
SERIE_1=Pie
SERIE_TYPE_1=PIE
PIE_STYLE_1=RED
PIE_STYLE_2=BLUE
PIE_STYLE_3=GREEN
PIE_NAME_1=Products
PIE_NAME_2=Services
PIE_NAME_3=Other
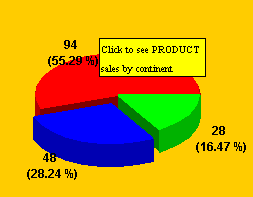
PIE_LABEL_FORMAT=#VALUE# (#PERCENTAGE#)
SERIE_DATA_1=94|48|28
SERIE_FONT_1=ARIAL|12
SERIE_LABELS_1=Products|Services|Other
SERIE_TIPS_1=Click to see PRODUCT sales by continent|Click to see SERVICES sales by continent|Click to see OTHER sales by continent
SERIE_LINKS_1=getChart.php?DATAFILE=http://localhost/chartphp/examples/subpiechart1.txt&WIDTH=300&HEIGHT=300|getChart.php?DATAFILE=http://localhost/chartphp/examples/subpiechart1.txt&WIDTH=300&HEIGHT=300|getChart.php?DATAFILE=http://localhost/chartphp/examples/subpiechart1.txt&WIDTH=300&HEIGHT=300
CHART_SHOW_TIPS=true
SERIE_TOGETHER_1=true|false|true
CHART_BORDER=0.2|BLACK|LINE
CHART_FILL=#FFCC00
LEGEND_BORDER=0.2|BLACK|LINE
LEGEND_VERTICAL=false
LEGEND_POSITION=TOP
LEGEND_FILL=WHITE
PIECHART_3D=true
The result is:
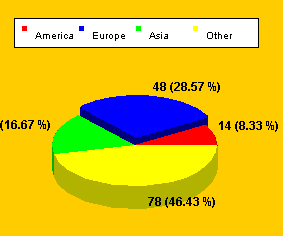
when the users clicks in the piechart the subchart will be displayed (see SERIE_LINKS_1 parameters above)
The content of subpiechart1.txt is:
TITLECHART=Sales Products
LEGEND=TRUE
SERIE_1=Pie
SERIE_TYPE_1=PIE
PIE_STYLE_1=RED
PIE_STYLE_2=BLUE
PIE_STYLE_3=GREEN
PIE_STYLE_4=YELLOW
PIE_NAME_1=America
PIE_NAME_2=Europe
PIE_NAME_3=Asia
PIE_NAME_4=Other
PIE_LABEL_FORMAT=#VALUE# (#PERCENTAGE#)
SERIE_DATA_1=14|48|28|78
SERIE_FONT_1=ARIAL|12
SERIE_LABELS_1=America|Europe|Asia|Other
CHART_BORDER=0.2|BLACK|LINE
CHART_FILL=#FFCC00
LEGEND_BORDER=0.2|BLACK|LINE
LEGEND_VERTICAL=false
LEGEND_POSITION=TOP
LEGEND_FILL=WHITE
PIECHART_3D=true
SERIE_TIPS_1=America|Europe|Asia|Other
CHART_SHOW_TIPS=true
When the user click on
the red slice, the following subchart will be loaded:
Charts can be automatically refreshed or updated with new data by means a small javascript function. The following example shows how this can be done:
<html>
<HEAD>
<SCRIPT LANGUAGE="JavaScript">
/* This script is set to
rotate every 3 seconds.
(5000=5 seconds, so 30000 would equal 30, etc)
You should change the number in the setTimeout()
call below for the number of seconds you wish. */
function refreshChart(){
document.ICHART.src='getDynamicChart.php'; // refresh link
setTimeout("refreshChart()",3000); // set next timeout
}
</SCRIPT>
</HEAD>
<BODY>
<?php
echo("<img src='getDynamicChart.php' BORDER=0 NAME='ICHART'>");
?>
<SCRIPT LANGUAGE="JavaScript">
<!-- Hide JavaScript from Java-Impaired Browsers
refreshChart();
// End Hiding -->
</SCRIPT>
</BODY>
The getDynamicChart.php page is a php page which creates the chart using realtime data, for example reading from a database. The following code can be used as template for this page:
<?php
// you must set these paths
ini_set("include_path", "C:\\web\\Apache\\htdocs\\rchartphp");
$sFilePrefix="http://localhost/rchartphp/examples/";
require("chartLoader.inc");
require("Chart.inc");
// load chart parameters
$loader= new ChartLoader();
$loader->loadFromFile($sFilePrefix."realtime.txt",false); // load
chart template
// update some parameters with dynamic data.
// 1. set initial value of the X Axis based on the time
$now=time();
$loader->setParameter("XAXIS_INITIAL_DATE",strftime("%m/%d/%Y
%H:%M:%S",$now));
// 2. create random data
based on the time. This is only an example.
// You could here read the data from a database.
$data1="";
$data2="";
for ($i=0;$i<9;$i++) {
$now=$now-2;
if (strlen($data1)>0) $data1="|".$data1;
$data1="".strftime("%S",$now).$data1;
if (strlen($data2)>0) $data2="|".$data2;
$data2="".floor(strftime("%S",$now)/6).$data2;
}
// set data
$loader->setParameter("SERIE_DATA_1",$data1);
$loader->setParameter("SERIE_DATA_2",$data2);
header("Pragma: no-cache");
header("Expires: Mon, 26 Jul 1997 05:00:00 GMT");
header("Cache-Control: no-store, no-cache,max-age=0, must-revalidate");
// create now chart
$g = new ChartGraphics;
$g->create(600,400);
$chart=& $loader->buildChart();
$chart->setSize(600,400);
$chart->paint($g);
$g->setType("png");
$g->outputImage( &$filename );
?>