Copyright 2005, J4L
Components (http://www.java4less.com)
Go bak to contents
This parameters can only be used in the interactive version of the ChartControl:
|
Parameters
|
Description
|
Equivalent c# class/property
|
|
WIDTH=300 |
Size of the control |
chartcontrol.setSize(300,300); |
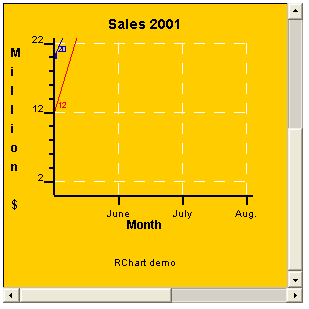
After you press the zoom out (-) button the result is:
If you want to disable the zoom buttons you must use the following parameter:
This section describes how to use the ChartListener to capture events triggered by RChart. Some of events are catched and processed by the ChartControl and you will rarely use them.
You can either implement the ChartListener interface or use the ChartAdapter class to create your own listener using the following code:
[c#]
chart.activateSelection=true; //
chart.addChartListener( new MyChartAdapter());
....class MyChartAdapter:ChartAdapter {
public MyChartAdapter() { }
public override void chartEvent(Chart c,int type) {if (type==Chart.EVENT_POINT_CLICKED)
MessageBox.Show("You just clicked on series "+ c.selectedSerie.name.ToUpper() + " point "+ (c.selectedSeriePoint+1));}
}
The example above will
detect when a value has been clicked on the chart and will prints its value.
Note that you must set:
chart.activateSelection=true;
If you also want the cursor to change when the mouse is over a point use this code:
chartControl.changePointer=true;
The events processed by the ChartControl are:
Other events are:
The following properties of the chart are normally used for the event processing:
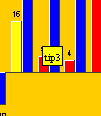
Tips are available in the ChartControl and in the ChartWebControl (as a HTML image map).
If you want to display tips when the mouse is placed over a bar, point or item you can use these parameters:
you can use "\n" in order to create multiline tips.
Use the following parameters to change the look of the tips:
if you also want to display the current position (Y axis value) of the cursor you can use:
CHART_SHOW_POSITION=true
|
Parameters
|
Description
|
Equivalent c# class/property
|
|
CHART_SHOW_TIPS=TRUE |
Activate tips |
ChartLoader loader=myChartControl.getChartLoader();
|
In the same way, you can also display tips in barcharts of in piecharts:
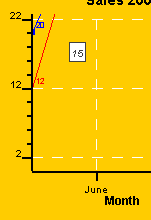
There is a special kind of tip which always displays the current possition of the cursor according to the Y scale:
|
Parameters
|
Description
|
Equivalent c# class/property
|
|
CHART_SHOW_POSITION=TRUE |
Activate position tips |
ChartLoader loader=myChartControl.getChartLoader(); |
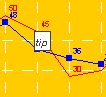
In the screenshot you see that the cursor was at position 15.
Note: See next section if you want to use tips with the ChartWebControl.
RChart will open an HTML when the user clicks on bar (barchart), point (linechart) or item (piechart). In order to activate this feature you must set the parameter: SERIE_LINKS_*.
For example, if your data series 1 has 3 values, you can set the parameter like this:
SERIE_LINKS_1=http://www.server.com/value1.html|http://www.server.com/value2.html|http://www.server.com/value3.html
Furthermore you can specify the frame where the HTML page will be displayed:
CHART_LINKS_TARGET=_new
Valid values are: "_new" (new browser's window) , "_top" (current window) and "<frame name>" (if you use frames).
If you want to activate Tips of Links you must use the ChartWebControl and the ChartMapWebControl classes:
You can also use c# or vb.net code instead of the WebControls.
The following aspx files will create a chart with tooltips and link:
[ChartMap.aspx] This file create the html image map and calls the aspx page which creates the gif image.
<%@ Page language="c#" AutoEventWireup="false" Trace="false" Debug="false" %>
<%@Import Namespace="System.Drawing" %>
<%@Import Namespace="System.IO" %>
<%@Import Namespace="System.Drawing.Imaging" %>
<%@Import Namespace="J4L.RChart" %>
<%@ OutputCache Duration="100" VaryByParam="none" %>
<script runat="server">// Insert page code here
//</script>
<html>
<head>
</head>
<body>
<form runat="server">
<img src="ChartC.aspx" useMap=#CHARTMAP border=0/>
<!-- Insert content here -->
</form>
Place cursor on the bars to see tooltips.
<%
// define variable
ChartLoader chartLoader= new ChartLoader();// set chart parameters
chartLoader.loadFromFile("data.txt",true);// create chart
Chart chart=chartLoader.buildChart();
chart.setSize(400,400);// create in memory image
Bitmap inMemoryImage = new Bitmap( chart.getSize().Width,chart.getSize().Height);
Graphics g = Graphics.FromImage(inMemoryImage);
// paint chart
chart.paint(g);String outputMap=chartLoader.getHTMLImageMap("CHARTMAP");
Response.Cache.SetCacheability(HttpCacheability.NoCache);
Response.Write(outputMap);%>
</body>
</html>
[ChartC.aspx] This file create the chart in gif format
<%@ Page language="c#" AutoEventWireup="false" Trace="false" Debug="false" %>
<%@Import Namespace="System.Drawing" %>
<%@Import Namespace="System.IO" %>
<%@Import Namespace="System.Drawing.Imaging" %>
<%@Import Namespace="J4L.RChart" %>
<%@ OutputCache Duration="100" VaryByParam="none" %>
<%
// define variable
ChartLoader chartLoader= new ChartLoader();// set chart parameters
chartLoader.loadFromFile("data.txt",true);
// create chart
Chart chart=chartLoader.buildChart();
chart.setSize(400,400);// create in memory image
Bitmap inMemoryImage = new Bitmap( chart.getSize().Width,chart.getSize().Height);
Graphics g = Graphics.FromImage(inMemoryImage);
// paint chart
chart.paint(g);
MemoryStream tempStream = new MemoryStream();// output image to the memory stream in gif format
inMemoryImage.Save(tempStream,ImageFormat.Gif);Response.ClearContent();
Response.Cache.SetCacheability(HttpCacheability.NoCache);
Response.ContentType = "image/gif";
Response.BinaryWrite(tempStream.ToArray());
Response.End();
%>
[data.txt] this file contains the chart definition
TITLECHART=Sales 2002
XLABEL=Month
YLABEL=Million $
XSCALE_MIN=0
XSCALE_MAX=5.5
YSCALE_MIN=-15
BIG_TICK_INTERVALX=1
BIG_TICK_INTERVALY=10
XAXIS_LABELS=June|July|Aug.|Sept.|Oct.|Nov.|Dec.
CERO_XAXIS=LINE
YAXIS_INTEGER=TRUE
SERIE_1=Products
SERIE_2=Services
SERIE_TYPE_1=BAR
SERIE_TYPE_2=BAR
SERIE_FONT_1=Arial|PLAIN|8
SERIE_FONT_2=Arial|PLAIN|8
SERIE_DATA_1=12|43|50|45|30
SERIE_TIPS_1=12|43|50|45|30 SERIE_LINKS_1=http://www.java4less.com|http://www.java4less.com|http://www.java4less.com|http://www.java4less.com|http://www.java4less.com CHART_SHOW_TIPS=true
SERIE_DATA_2=-10|41|48|39|36
SERIE_BORDER_TYPE_1=RAISED S
ERIE_BORDER_TYPE_2=RAISED
SERIE_BAR_STYLE_1=ff00
SERIE_BAR_STYLE_2=ff
BARCHART_BARSPACE=1
LEFT_MARGIN=0.15
CHART_FILL=ffcc00
SERIE_NEGATIVE_STYLE_2=RED
YLABEL_VERTICAL=TRUE
You can create drill down charts using in the following way:
For example, the following apsx code will create a drilldown Pie chart for the Web:
<%@ Page Language="c#" autoeventwireup="false" Trace="false" Debug="false" %>
<%@ import Namespace="System.Drawing" %>
<%@ import Namespace="System.IO" %>
<%@ import Namespace="System.Drawing.Imaging" %>
<%@ import Namespace="J4L.RChart" %>
<%@ outputcache duration="100" varybyparam="none" %>
<script runat="server"></script>
<html>
<head>
</head>
<body>
<form runat="server">
<img src="ChartDrillDown.aspx" usemap="#CHARTMAP" border="0" />
<!-- Insert content here -->
</form>
Place cursor on the bars to see tooltips. <%
// define variable
ChartLoader chartLoader= new ChartLoader();
String paramFile="piechart.txt";
if (Request.Params.Count>0)
if (Request.Params.Get("DATA")!=null) paramFile=Request.Params.Get("DATA");// set chart parameters
chartLoader.loadFromFile(paramFile,true);// create chart
Chart chart=chartLoader.buildChart();
chart.setSize(400,400);// create in memory image
Bitmap inMemoryImage = new Bitmap( chart.getSize().Width,chart.getSize().Height);
Graphics g = Graphics.FromImage(inMemoryImage);
// paint chart
chart.paint(g);
String outputMap=chartLoader.getHTMLImageMap("CHARTMAP");Response.Cache.SetCacheability(HttpCacheability.NoCache);
Response.Write(outputMap);
%>
</body>
</html>
The content of the data file is:
[piechart.txt]
TITLECHART=Sales 1999
LEGEND=TRUE
SERIE_1=Pie
SERIE_TYPE_1=PIE
PIE_STYLE_1=RED
PIE_STYLE_2=BLUE
PIE_STYLE_3=GREEN
PIE_NAME_1=Products
PIE_NAME_2=Services
PIE_NAME_3=Other
PIE_LABEL_FORMAT=#VALUE# (#PERCENTAGE#)
SERIE_DATA_1=94|48|28
SERIE_FONT_1=ARIAL|BOLD|12
SERIE_LABELS_1=Products|Services|Other
SERIE_TIPS_1=Click to see PRODUCT sales by continent|Click to see SERVICES sales by continent|Click to see OTHER sales by continent
SERIE_LINKS_1=ChartDrillDown.aspx?DATA=subpiechart1.txt|ChartDrillDown.aspx?DATA=subpiechart1.txt|ChartDrillDown.aspx?DATA=subpiechart1.txt
CHART_SHOW_TIPS=true
CHART_JAVASCRIPT_EVENTS=true
SERIE_TOGETHER_1=true|false|true
CHART_BORDER=0.2|BLACK|LINE
CHART_FILL=LIGHTGRAY
LEGEND_BORDER=0.2|BLACK|LINE
LEGEND_VERTICAL=false
LEGEND_POSITION=TOP
LEGEND_FILL=WHITE
PIECHART_3D=true
BACK_IMAGE=back19.jpg
The result is:
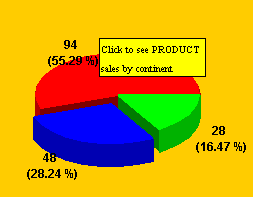
when the users clicks in the piechart the following page is executed (see SERIE_LINKS_1 parameters above, ChartDrillDown.aspx?DATA=subpiechart1.txt)
[ChartDrillDown.aspx]
<%@ Page language="c#" AutoEventWireup="false" Trace="false" Debug="false" %>
<%@Import Namespace="System.Drawing" %>
<%@Import Namespace="System.IO" %>
<%@Import Namespace="System.Drawing.Imaging" %>
<%@Import Namespace="J4L.RChart" %>
<%@ OutputCache Duration="100" VaryByParam="none" %>
<%
// define variable
ChartLoader chartLoader= new ChartLoader();
String paramFile="piechart.txt";
if (Request.Params.Count>0)
if (Request.Params.Get("DATA")!=null) paramFile=Request.Params.Get("DATA");// set chart parameters
chartLoader.loadFromFile(paramFile,true);// create chart
Chart chart=chartLoader.buildChart();
chart.setSize(400,400);// create in memory image
Bitmap inMemoryImage = new Bitmap( chart.getSize().Width,chart.getSize().Height);
Graphics g = Graphics.FromImage(inMemoryImage);
// paint chart
chart.paint(g);
MemoryStream tempStream = new MemoryStream();// output image to the memory stream in gif format
inMemoryImage.Save(tempStream,ImageFormat.Gif);Response.ClearContent();
Response.Cache.SetCacheability(HttpCacheability.NoCache);
Response.ContentType = "image/gif";
Response.BinaryWrite(tempStream.ToArray());
Response.End();
%>
The content of subpiechart1.txt is:
TITLECHART=Sales Products
LEGEND=TRUE
SERIE_1=Pie
SERIE_TYPE_1=PIE
PIE_STYLE_1=RED
PIE_STYLE_2=BLUE
PIE_STYLE_3=GREEN
PIE_STYLE_4=YELLOW
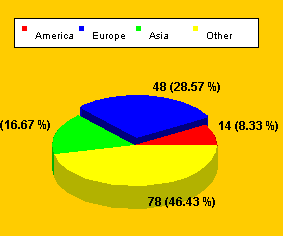
PIE_NAME_1=America
PIE_NAME_2=Europe
PIE_NAME_3=Asia
PIE_NAME_4=Other
PIE_LABEL_FORMAT=#VALUE# (#PERCENTAGE#)
SERIE_DATA_1=14|48|28|78
SERIE_FONT_1=ARIAL|BOLD|12
SERIE_LABELS_1=America|Europe|Asia|Other
CHART_BORDER=0.2|BLACK|LINE
CHART_FILL=LIGHTGRAY
LEGEND_BORDER=0.2|BLACK|LINE
LEGEND_VERTICAL=false
LEGEND_POSITION=TOP
LEGEND_FILL=WHITE
PIECHART_3D=true
BACK_IMAGE=back19.jpg
CHART_JAVASCRIPT_EVENTS=false
SERIE_TIPS_1=America|Europe|Asia|Other
CHART_SHOW_TIPS=true
When the user click on
the red slice, the following subchart will be loaded:
If you want to create a drill down chart in a windows application you must implement the ChartListener interface like this:
public override void chartEvent(Chart c,int type) {
// load subchart
if (type==Chart.EVENT_POINT_CLICKED) {if (c.selectedSeriePoint==0) loadNewChart("examples2/subpie1.txt");
else if (c.selectedSeriePoint==1) loadNewChart("examples2/subpie2.txt");
else if (c.selectedSeriePoint==2) loadNewChart("examples2/subpie3.txt");}
}
where the loadNewChart function would create a new chart (see our sample application ChartViewer.cs)