Copyright 2005, J4L
Components (http://www.java4less.com)
Go bak to contents
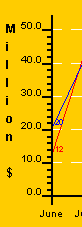
RChart supports 3 axis, a horizontal axis (X) at the bottom of the chart, and 2 vertical axis to the left (Y) and to the right (Y2) of the chart.
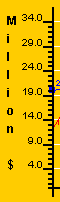
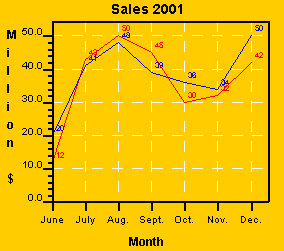
Each Axis can have an associate label. The label of the following example is "Million $":
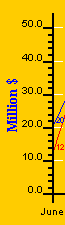
The properties of the label are:
The following example paints a blue vertical label with "Serif" font:
|
Parameters
|
Description
|
Equivalent c# class/property
|
|
YLABEL=Million $ |
Text of label |
chart.YLabel=new VAxisLabel("Million",color,font); |
RChart supports 2 kind of ticks:
There are 2 ways you can control the number and position of the ticks in the scale:
Manual: You can use the following parameters to define the spacing between ticks:
the default values are:
|
Parameters
|
Description
|
Equivalent c# class/property
|
|
TICK_INTERVALY=1 |
Small ticks for each unit of the scale |
yAxis.scaleTickInterval=1; |
![]()
an example is:
|
Parameters
|
Description
|
Equivalent c# class/property
|
|
TICK_INTERVALY=2 |
the result will be one big tick after 20 unit
(2*10) |
yAxis.scaleTickInterval=2; |
![]()
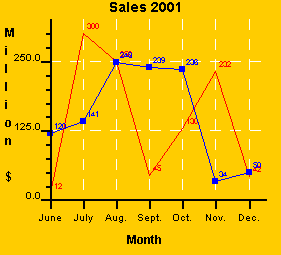
Automatic: you can also let RChart calculate the value for the tick interval using the following parameters:
VALUE="0.1|0.5|1|5|10|25|50|100|250|500|1000|5000|10000|50000|100000|500000|1000000"
For example, if your values range from 0 till 300 and the desired number of ticks is 10. RChart will select tick_interval=25 which will result in 12 ticks. See screenshot.
Other ticks parameters
|
Parameters
|
Description
|
Equivalent c# class/property
|
|
YAXIS_START_WITH_BIG_TICK=false |
First tick should be small |
chart.YAxis.startWithBigTick=false; |
|
Parameters
|
Description
|
Equivalent c# class/property
|
|
YAXIS_START_WITH_BIG_TICK=false |
First tick should be small |
chart.YAxis.startWithBigTick=false; |
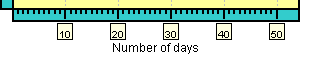
If you don't want to have small ticks you can set BIG_TICK_INTERVALY=1. For example:
|
Parameters
|
Description
|
Equivalent c# class/property
|
|
TICK_INTERVALY=5 |
One tick every 5 units |
chart.YAxis.scaleTickInterval=5; |
![]()
Ticks at irregular interval
The tick interval parameters allows you to define the position of the ticks. These are displayed at fixed intervals only. You can also use the BIG_TICK_INTERVAL_LISTY parameter to define the positions where the big ticks should appear. For example:
|
Parameters
|
Description
|
Equivalent c# class/property
|
|
TICK_INTERVALY=5 |
One tick every 5 units |
chart.YAxis.scaleTickInterval=5; |
The following parameters allow you to control the length of the ticks. For example, you can remove the small ticks by making its length=0:
|
Parameters
|
Description
|
Equivalent c# class/property
|
|
YAXIS_TICKPIXELS=0 |
Length of small ticks (0, invisible) |
chart.YAxis.tickPixels=0; |
![]()
Labels are always displayed at the big ticks positions. The following parameters allow you to modify the labels.
XAXIS_LABEL_FORMAT. If XAXIS_INTEGER is false, this format will be used to draw the label. For example "##.00" will always display 2 decimal digits. The format uses the following symbols:
|
Parameters
|
Description
|
Equivalent c# class/property
|
|
YAXIS_LABEL_FORMAT=###.# |
Use only 1 decimal digit in the tick labels |
chart.YAxis.scaleLabelFormat; |
![]()
The following parameter will remove the digits right of the decimal separator:
|
Parameters
|
Description
|
Equivalent c# class/property
|
|
YAXIS_INTEGER=true |
Do not use decimal values in labels of the ticks. |
chart.YAxis.IntegerScale=true |
|
Parameters
|
Description
|
Equivalent c# class/property
|
|
YAXIS_LABELS=cero|one|two|three|four|five |
User defined labels for the big ticks. |
chart.YAxis.tickLabels={"cero","one",....}; |
![]()
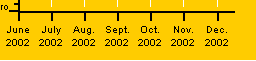
You can split your labels in sereval lines by using "\n".
|
Parameters
|
Description
|
Equivalent c# class/property
|
|
XAXIS_VERTICAL_LABELS=false. XAXIS_LABELS=June\n2002|July\n2002|Aug.\n2002|
|
If "true" the labels will be painted
with a 90 degrees rotation. |
chart.XAxis.verticalLabels; |
or paint labels vertically:
|
Parameters
|
Description
|
Equivalent c# class/property
|
|
XAXIS_VERTICAL_LABELS=TRUE |
Rotate labels |
chart.XAxis.verticalLabels; |

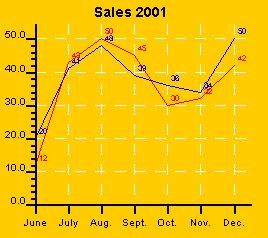
RChart will by default no display a grid:
however you can add the grid with the following parameters:
|
Parameters
|
Description
|
Equivalent c# class/property
|
|
XAXIS_GRID=1|0xffffff|DASHED
|
Line style of the grid |
chart.XAxis.gridStyle; |
which let you define the style of the line used for the grid lines.
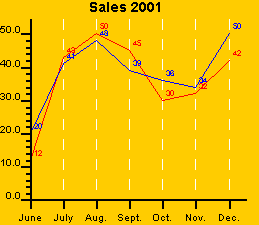
If you want to get a finer grid you can display the grid at the small tick positions with:
|
Parameters
|
Description
|
Equivalent c# class/property
|
|
XAXIS_GRID=1|0xffffff|DASHED
|
Line style of the grid |
chart.XAxis.gridStyle; |
You can of course display lines for 1 axis only, for example:
|
Parameters
|
Description
|
Equivalent c# class/property
|
|
XAXIS_GRID=1|0xffffff|DASHED
|
Only vertical grid |
chart.XAxis.gridStyle; |
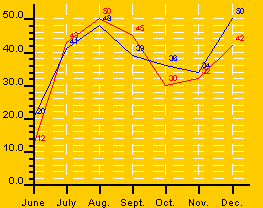
You can also set an alternate filling for the grid. In the example you see the background alternates white and grey.
|
Parameters
|
Description
|
Equivalent c# class/property
|
|
YAXIS_FILL_GRID=0xE0E0E0; |
Grid filling (grey) |
axis.gridFillStyle= FillStyle.createFromString( "0xE0E0E0")
; |
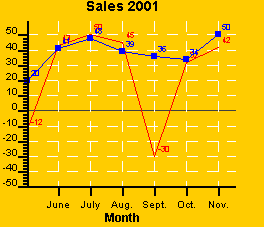
If you scale's minimum value is less than cero, you might want to paint a line at the cero possition to be used as reference by the user.
|
Parameters
|
Description
|
Equivalent c# class/property
|
|
CERO_XAXIS=LINE |
Draw line at Y axis, possition 0 |
chart.XAxis.ceroAxis=Axis.CEROAXIS_LINE; |
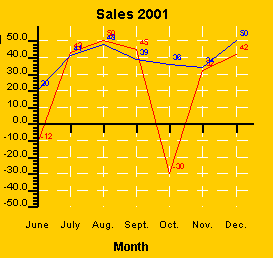
You can also define the cero axis to include the ticks (the labels are still painted at the bottom of the chart).
|
Parameters
|
Description
|
Equivalent c# class/property
|
|
CERO_XAXIS=SCALE |
Draw scale at Y axis position 0 |
chart.XAxis.ceroAxis=Axis.CEROAXIS_SCALE |
The following parameters allows you create a "frame" around the chart.
|
Parameters
|
Description
|
Equivalent c# class/property
|
|
XAXIS_CLOSED=TRUE |
draw lines at the top and on right of the chart to get a closed box. |
chart.XAxis.axisFrame=true; |
You can also use dates as labels for the ticks with the following parameters:
|
Parameters
|
Description
|
Equivalent c# class/property
|
|
BIG_TICK_INTERVALX=2 |
Ticks Interval |
chart.YAxis.bigTickInterval; |
will result in the following secuence of ticks/labels
- big tick, label "01-Jan-01"
- small tick, no label
- big tick, label "03-Jan-01"
- small tick, no label
- big tick, label "05-Jan-01"
- .....
Example 1:
|
Parameters
|
Description
|
Equivalent c# class/property
|
|
XAXIS_DATE_FORMAT=MMM |
Format of the date (only month name) |
chart.YAxis.dateLabelFormat; |
![]()
Example 2:
|
Parameters
|
Description
|
Equivalent c# class/property
|
|
XAXIS_DATE_FORMAT=dd-MMM |
Format of the date |
chart.YAxis.dateLabelFormat; |
![]()
Example 3:
|
Parameters
|
Description
|
Equivalent c# class/property
|
|
XAXIS_DATE_FORMAT=HH:mm |
Format of the date |
chart.YAxis.dateLabelFormat; |
![]()
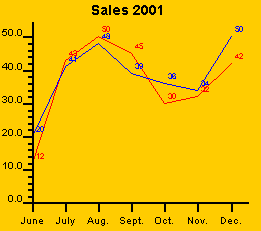
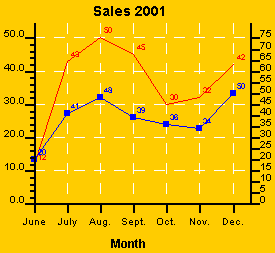
In order to activate the second Y axis you must use:
Y2AXIS =true
then you can define which data serie will use the scale of the second axis (serie 2 is the blue line)
|
Parameters
|
Description
|
Equivalent c# class/property
|
|
Y2AXIS =true |
Activate second/right Y axis |
chart.setY2Scale(cY2Axis); |
The following three parameters define the color and style of the axis
|
Parameters
|
Description
|
Equivalent c# class/property
|
|
YAXIS_STYLE=2|0xff|NORMAL |
Style of the axis |
chart.YAxis.style; |
![]()
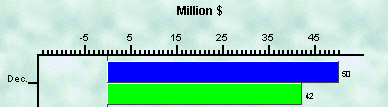
Axis can be painted as a bar (see screenshot below) using the following parameters:
where ? is X, Y , Y2 , X_1 ... and so on
|
Parameters
|
Description
|
Equivalent c# class/property
|
|
XAXIS_BAR_STYLE=BAR |
Style of the axis |
axis.barStyle=Axis.BAR_STYLE_BAR; |
![]()
If you want to place the x scale on the top of the chart, instead of on the bottom you can use the following parameters:
|
Parameters
|
Description
|
Equivalent c# class/property
|
|
XAXIS_ON_TOP=TRUE |
Place it on top |
chart.XAxis.scaleOnTop; |
Note that this is not supported for 3D charts.
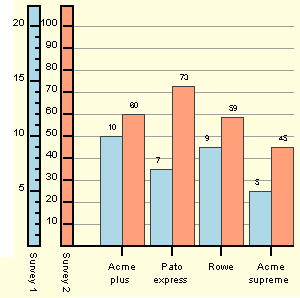
In addition to the main axis (Y , X and Y2 axis) you can define additional (or secondary) axis which are displayed parallel to the main axis. There is no limit in the number of axis you define other than the space available in your chart. If you create secondary axis you will normally also need to increase the margin reserved for the axis (left , bottom or right margin).
Secondary axis can be enabled with the ?_AXIS parameter where ? can be X_1, X_2 ... for the X axis, Y1_, Y_2 ... for the Y axis and Y2_1, Y2_2 ... for the Y2 axis ( right hand side Y axis).
The following screenshot displays a chart with a secondary Y axis (the blue one):
|
Parameters
|
Description
|
Equivalent c# class/property
|
|
Y_1AXIS=TRUE |
Enable secondary axis (blue) |
y_1axis=new Axis(Axis.VERTICAL,new Scale()); |
The parameters SERIE_SECONDARY_XAXIS_* and SERIE_SECONDARY_YAXIS_* are used to specify that a given data serie must be plotted using a secondary axis.
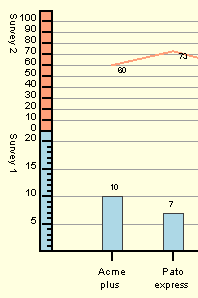
The axis can also be stacked as in the screenshot below using the parameter ?AXIS_STACK_ADDITIONAL=TRUE. As a result the chart gets splitted in 2 areas which can be used to plot 2 charts one on the top of the other:
|
Parameters
|
Description
|
Equivalent c# class/property
|
|
YAXIS_STACK_ADDITIONAL=TRUE |
Stack axis |
yaxis.stackAdditionalAxis=true; |
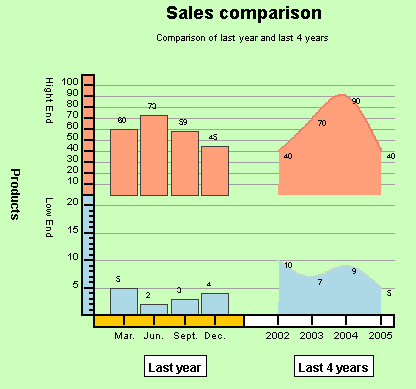
If you also create a secondary axis for the X axis and stack them, you will get 4 subcharts as in the screenshot:
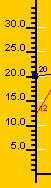
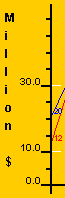
Axis Target zones are used to remark a range of values in the axis. The following screenshot shows an axis with 2 target areas:
![]()
As you can see target zones can be lines or areas (with start and end positions). The ?AXIS_TARGET_ZONE_* parameters are used to add target zones to the charts. The syntax of the parameter is:
?AXIS_TARGET_ZONE_*=<start value>;<end value>;<line style>;<fill style>;<label>
where:
The 2 zones in the example above are defined as:
|
Parameters
|
Equivalent c# class/property
|
|
Y_AXIS_TARGET_ZONE_1=0%;30%;;RED;@rotation value='90'@@color value='RED'@Dissatisfied Y_AXIS_TARGET_ZONE_2=70%;100%;;GREEN;@rotation value='90'@@color value='GREEN'@Satisfied |
String value="0%;30%;;RED;@rotation valu........"; OR AxisTargetZone zone=new AxisTargetZone(0,30, IConstants.UNIT_PERCENTAGE,
IConstants.UNIT_PERCENTAGE); |
The ?AXIS_TEMPLATE parameter allows you to define a template which will be applied to the labels which must be painted next to the axis ticks. The template must contain the string #value# which will be replaced by the actual value of the tick to be painted.
The following screenshot and table shows an example of use of this parameter:
|
Parameters
|
Equivalent c# class/property
|
|
XAXIS_TEMPLATE=@background value='LIGHTYELLOW'@@position value='+0px,+5px'@@border value='1|BLACK|NORMAL'@ #value# |
axis.labelTemplate="@background value='LIGHTYELLOW'@@position
value='+0px,+5px'@@border value='1|BLACK|NORMAL'@ #value#"; |