RCHART, User Guide
Copyright 2005, J4L
Components (http://www.java4less.com)
Go bak to contents
Scale configuration / parameters
Maximum
and minimum values
The following section describes
how the maximum and minimum values of the scale are calculated. The examples
refer to the Y-Axis, however the same parameters are also available for the
X and Y2 axis.
If you want to plot the
following values:
10, 41 , 48 , 39, 36 ,34
, 49
you can use the following
way in order to calculate the maximum and minimum values of the axis:
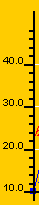
- default maximum and
minimum. If you do not specify the minimum and/or maximum value for the scale,
rchart will use the minimum and maximum value of the set you want to chart.
The result will be: minimum=10 and maximum=49
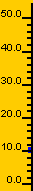
- specify maximum and
minimum. You can also calculate the values and pass them to rchart. For example
you can use
|
Parameters
|
Description
|
Equivalent java class/property
|
|
YSCALE_MIN=0
YSCALE_MAX=50
|
Minimum value of the scale
Maxumim value of the scale
|
xaxis.scale.min
yaxis.scale.max
|
the result will be:
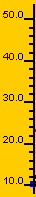
- preferred maximum and
minimum. You can also let RChart calculate the values from a list of predefined
values. In this case you must use the following parameters:
|
Parameters
|
Description
|
Equivalent java class/property
|
|
YSCALE_EXACT_MAX=true
YSCALE_EXACT_MIN=true
YSCALE_PREF_MAXMIN=-1000000|-500000|-100000|-50000|-10000|-5000|-1000|-500|-250|-100|-50|-25-10|-5|-1|-0.5|-|0.1|0|0.1|0.5|1|5|10|25|50|100|250|500|1000|5000|10000|50000|100000|500000|1000000
|
Take the min. and max. values from the list of
preferred values.
|
yaxis.scale.exactMaxValue
yaxis.scale.exactMinValue
yaxis.scale.preferred_MaxMin_values
|
RChart will use one of
the values from the list you provided. This list must be sorted in ascending
order and RChart will always select the first value that meets the condition:
- for the minimum: will
select the highest value that is smaller than all values in your data set.
(See red value in list)
- for the maximum: will
select the lowest value that is higher than all values in your data set. (See
blue value in list)
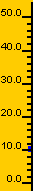
- You can also combine
all methods. For example you can set the minimum value as 0 always and let
RChart calculate the maximum value:
|
Parameters
|
Description
|
Equivalent java class/property
|
|
YSCALE_MIN=0
YSCALE_EXACT_MIN=false
YSCALE_EXACT_MAX=true
YSCALE_PREF_MAXMIN=-1000000|-500000|-100000|-50000|-10000|-5000|-1000|-500|-250|-100|-50|-25-10|-5|-1|-0.5|-|0.1|0|0.1|0.5|1|5|10|25|50|100|250|500|1000|5000|10000|50000|100000|500000|1000000
|
Minimum is 0
Take max. value from the list of preferred values.
|
yaxis.scale.min
yaxis.scale.exactMaxValue
yaxis.scale.exactMinValue
yaxis.scale.preferred_MaxMin_values
|
Logarithmic
Scales
the following additional
parameters are needed for logarithmic scales:
- XSCALE_LOG, YSCALE_LOG
and Y2SCALE_LOG. if "true" the scale will be logarithmic.
- XSCALE_LOG_BASE, YSCALE_LOG_BASE
and Y2SCALE_LOG_BASE. Base of the logarithm.
- TICK_LOG_INTERVALY,TICK_LOG_INTERVALX
and TICK_LOG_INTERVALY2. If "true" the ticks will be printed at
logarithmic intervals (which is fixed intervals in the screen). If false the
TICK_INTERVAL will be used to draw the ticks at fixed value intervals (not
screen intervals).
Note: logarithmic scales do not accept negative values.
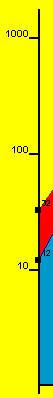
Example 1:
A base of 10 means that
the distance between 1 and 10 will be the same as the distance between 10 and
100, 100 and 1000 ...
|
Parameters
|
Description
|
Equivalent java class/property
|
|
TICK_LOG_INTERVALY=true
YSCALE_LOG= true
YSCALE_LOG_BASE=10
YSCALE_MIN=0
YSCALE_MAX = 1000
|
Ticks show not be placed at fixed intervals bu
using logaritmic scale.
Y Scale will use logarithmin scale
base 10
minimum and maximum values
|
YAxis.logarithmicIntervals=true;
YAxis.scale=logScale();
((logScale) YAxis.scale).base=10;
YAxis.scale.min=0;
YAxis.scale.min=1000;
|
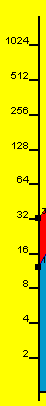
Example 2:
The default base is 2.
This means, the distance between 1 and 2 will be the same as the distance between
2 and 4, 4 and 8..
|
Parameters
|
Description
|
Equivalent java class/property
|
|
TICK_LOG_INTERVALY=true
TSCALE_LOG=true
YSCALE_LOG_BASE=2
YSCALE_MIN=0
YSCALE_MAX = 1024
|
Ticks show not be placed at fixed intervals bu
using logaritmic scale.
Y Scale will use logarithmin scale
base 2
minimum and maximum values
|
YAxis.logarithmicIntervals=true;
YAxis.scale=logScale();
((logScale) YAxis.scale).base=2;
YAxis.scale.min=0;
YAxis.scale.min=1024;
|
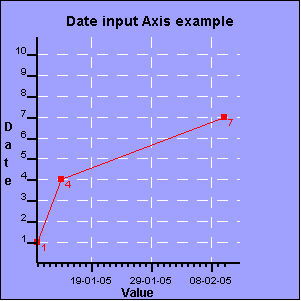
Date
and time based scales
The following example shows
a chart that has a date based X axis/scale. As you can see in the table below
the SERIE_DATAX_1 parameter, we are providing the position of the values not
as an integer value but as a date value (The same procedure could be used for
the Y value using SERIE_DATA if you have a date based Y scale).
|
Parameters
|
Description
|
Equivalent java class/property
|
|
XAXIS_INITIAL_DATE=10/01/2005
XAXIS_FINAL_DATE=10/03/2005
XAXIS_DATE_STEP=d
XAXIS_DATE_FORMAT=dd-MM-yy
SERIE_DATAX_1 =10/01/2005|14/01/2005|10/02/2005
TITLECHART=Date input Axis example
LEGEND=FALSE
XLABEL=Date
YLABEL=Value
SERIE_1=Serie 1
SERIE_STYLE_1=1|RED|LINE
SERIE_FONT_1=Arial|PLAIN|10
SERIE_COLOR_1=RED
SERIE_POINT_COLOR_1=RED
SERIE_POINT_1=true
SERIE_DATA_1=1|4|7
SERIE_TYPE_1=LINE
CHART_BORDER=0.2|BLACK|LINE
CHART_FILL=0xA0A0FF
BIG_TICK_INTERVALX=10
BIG_TICK_INTERVALY=1
TICK_INTERVALX=1
TICK_INTERVALY=1
YSCALE_MIN=0
XSCALE_MIN=0
LEGEND_BORDER=0.2|BLACK|LINE
LEGEND_FILL=WHITE
XAXIS_GRID=0.2|WHITE|DASHED
YAXIS_GRID=0.2|WHITE|DASHED
XAXIS_TICKATBASE=true
GRIDY=true
GRIDX=true
|
These are the parameters related to the date scale.
Minimum value of the scale
Maximum value of the scale
Tick step (1 days)
Format of the labels in the axis
Position of the x values
The rest of parameters required to create the chart
are explained in other sections of this manual.
|
XAxis.dateStepPerUnit=true; // enable dateStep property
XAxis.initialDate=initialdate;
XAxis.dateStep="d";
XAxis.scale.max=60; // days,units between initial and final date
XAxis.dateLabelFormat="dd-MM-yy";
// create data serie, first convert dates to double values
double value1= Axis.convertFromDate( date1, dateStep, initialdate);
double value2= Axis.convertFromDate( date2, dateStep, initialdate);
...
double[] valuesX={value1,value2....};
serie1=new LineDataSerie(valuesX, valuesY, lineStyle);
|
The description of the
parameters required to define a date (or time) based scale are:
- XAXIS_INITIAL_DATE or
YAXIS_INITIAL_DATE: Start date or time of the scale. The format must be dd-MM-yyyy
or (dd-MM-yyyy HH:mm:ss for time values). You can also use / as date separator.
- XAXIS_FINAL_DATE or
YAXIS_FINAL_DATE: End date or time of the scale.
- XAXIS_DATE_STEP or
YAXIS_DATE_STEP: Working unit fo axis and scale (d-days, m-month, w-week,
y-year, h-hour, s-second-n-minutes). The value can be followed by a integer
value ("d7" mean 7 days which would the same as "w").
For example a XAXIS_DATE_STEP=m
and a TICK_INTERVALX=2 means rchart will paint a tick every 2 months.
- XAXIS_DATE_FORMAT or
YAXIS_DATE_FORMAT: output format of the dates in the tick labels.
The following example shows how to create a time based scale:
SERIE_DATAX_1=01/01/2005 1:20:00|01/01/2005 1:35:00|01/01/2005 1:45:00|01/01/2005
2:00:00
XAXIS_INITIAL_DATE=01-01-2005 00:00:00
XAXIS_FINAL_DATE=01-01-2005 03:00:00
XAXIS_DATE_STEP=n20
XAXIS_DATE_FORMAT=HH:mm
Note that the date "01-01-2005"
is irrelevant since wer are only displaying the time value. The unit is 20 minutes
(n20) between 00:00:00 and 03:00:00.