Copyright 2005, J4L Components (http://www.java4less.com)
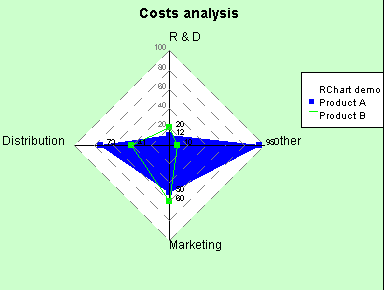
This is a complete example of a radar chart:
|
Parameters
|
Description
|
Equivalent java class/property
|
|
| WIDTH=390 HEIGHT=300 TITLECHART=Costs analysis SERIE_1=Product A SERIE_2=Product B SERIE_TYPE_1=RADAR SERIE_TYPE_2=RADAR SERIE_FONT_1=Arial|PLAIN|8 SERIE_FONT_2=Arial|PLAIN|8 SERIE_DATA_1=12|73|50|95 SERIE_DATA_2=20|41|60|10 SERIE_STYLE_1=0.2|BLUE|LINE SERIE_STYLE_2=0.2|GREEN|LINE SERIE_FILL_1=BLUE SERIE_POINT_1=true SERIE_POINT_2=true SERIE_POINT_COLOR_1=BLUE SERIE_POINT_COLOR_2=GREEN RADARCHART_BACK=WHITE RADARCHART_BORDER=0.2|BLACK|LINE RADARCHART_FACTOR_COLOR=BLACK RADARCHART_FACTOR_FONT=Arial|PLAIN|12 RADARCHART_FACTOR_MAX=100|100|100|100 RADARCHART_FACTOR_MIN=0|0|0|0 RADARCHART_FACTOR_NAMES=R & D|Distribution|Marketing|other RADARCHART_GRID=0.2|GRAY|DASHED RADARCHART_GRID_FONT=Arial|PLAIN|8 RADARCHART_GRID_FONT_COLOR=GRAY RADARCHART_RADIUS=0.8 CHART_BORDER=0.2|0x0|NORMAL CHART_FILL=0xccffcc |
Size |
radarPlotter=new RadarPlotter();
serie1=new LineDataSerie(values,lstyle); serie1.valueFont=new Font(...);
serie1.fillStyle=FillStyle( GraphicsProvider.getColor(ChartColor.BLUE)); |
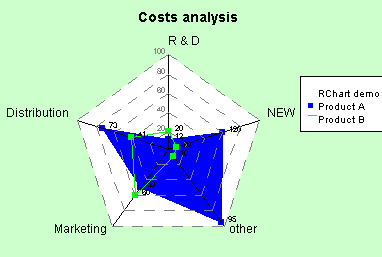
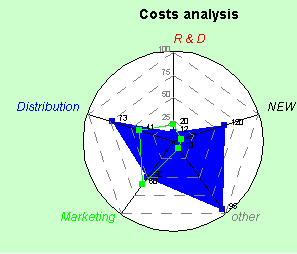
It is also possible to have more than 4 factors (axis). In the following example we have a new axis called "NEW" whose scale is different from the others, 0 to 200.
|
Parameters
|
Description
|
Equivalent java class/property
|
|
| SERIE_DATA_1=12|73|50|95|120 SERIE_DATA_2=20|41|60|10|20 RADARCHART_FACTOR_MAX=100|100|100|100|200 RADARCHART_FACTOR_MIN=0|0|0|0|0 RADARCHART_FACTOR_NAMES=R & D|Distribution|Marketing|other|NEW |
Values to plot (series 1).
|
See above |
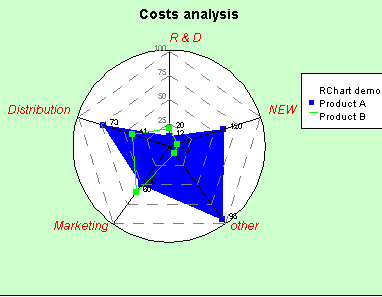
It is also possible to have a circular radar chart using the following parameters:
|
Parameters
|
Description
|
Equivalent java class/property
|
|
|
RADARCHART_CIRCLE=TRUE |
Circular chart |
radarPlotter.drawCircle=true; |
You can use different colors for each factor name using the following parameter:
|
Parameters
|
Description
|
Equivalent java class/property
|
|
|
RADARCHART_FACTOR_COLORS=RED|BLUE|GREEN|GRAY|BLACK |
List of colors |
radarPlotter.factorColors |
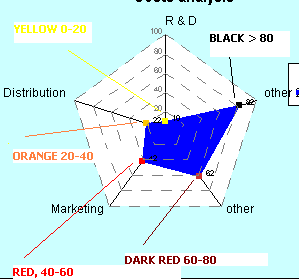
The following 2 parameters allows you to change the color of the points, depending on the value:
Example:
|
Parameters
|
Description
|
Equivalent java class/property
|
|
|
RADARCHART_POINT_COLORS_SCALE=20|40|60|80 RADARCHART_POINT_COLORS=0xffff00|0xffc800|0xff0000|0xcc3333|0x0 |
Scale |
radarPlotter.pointColorsScale |
values under 20 will have a yellow point, values between 20 and 40 will have an orange color, values beetwen 40 and 60 will have a red color, values beetwen 60 and 80 will have a dark red color and values above 80 will have a black point.