Copyright 2005, J4L
Components (http://www.java4less.com)
Go bak to contents
|
Parameters
|
Description
|
Equivalent java class/property
|
|
|
Size of the control |
...... |
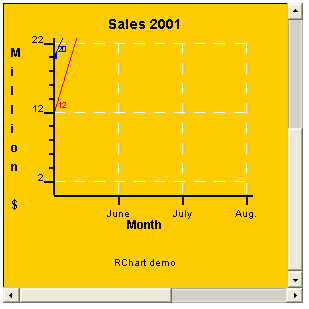
After you press the zoom out (-) button the result is:
If you want to disable the zoom buttons you must use the following parameter:
This section describes how to use the com.java4less.rchart.ChartListener to capture events triggered by RChart. Some of events are cacthed and processed by the ChartViewer and you will rarely used them.
You can either implement the ChartListener inteface or use the ChartAdapter class to create your own listener using the following code:
chart.activateSelection=true; //
chart.addChartListener( new ChartAdapter() {
public void chartEvent(Chart chart,int type) {
// process event here
if (type==ChartListener.EVENT_POINT_CLICKED)
System.out.println("Point clicked " + chart.selectedSerie.name + " "+ chart.selectedSeriePoint);
}
});
The example above will
detect when a value has been clicked on the chart and will prints its value.
Note that you must set:
chartViewer.activateSelection=true;
If you also want the cursor to change when the mouse is over a point use this code:
chartViewer.changePointer=true;
The events processed by the ChartViewer are:
Other events are:
The following properties of the chart are normally used for the event processing:
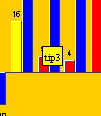
If you want to display tips when the mouse is placed over a bar, point or item you can use these parameters:
you can use "\n" in order to create multiline tips.
Use the following parameters to change the look of the tips:
if you also want to display the current position (Y axis value) of the cursor you can use:
CHART_SHOW_POSITION=true
|
Parameters
|
Description
|
Equivalent java class/property
|
|
CHART_SHOW_TIPS=TRUE |
Activate tips |
chart.showTips=true; |
In the same way, you can also display tips in barcharts of in piecharts:
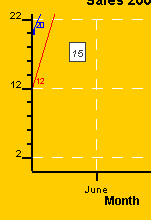
There is a special kind of tip which always displays the current position of the cursor according to the Y scale:
|
Parameters
|
Description
|
Equivalent java class/property
|
|
CHART_SHOW_POSITION=TRUE |
Activate position tips |
chart.showPosition=true; |
In the screenshot you see that the cursor was at position 15.
As explained in the previous sections, the ChartListener can be used to know when the used clicks on a bar, point or item. The following code will print a message in the java standard output when the user clicks on a value (bar, point or item)
chart.activateSelection=true;
chart.addChartListener( new ChartAdapter() {
public void chartEvent(Chart chart,int type) {
// process event here
if (type==ChartListener.EVENT_POINT_CLICKED)
System.out.println("Point clicked " + chart.selectedSerie.name + "
"+ chart.selectedSeriePoint);
}
});
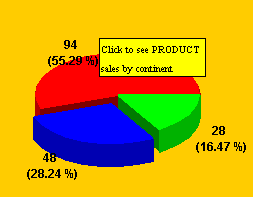
The EVENT_POINT_CLICKED event is commounly used for implementing drill down charts. The following example shows how this can be achieved.
You create a main chart using the following parameters:
TITLECHART=Sales
LEGEND=TRUE
SERIE_1=Pie
SERIE_TYPE_1=PIE
PIE_STYLE_1=RED
PIE_STYLE_2=BLUE
PIE_STYLE_3=GREEN
PIE_NAME_1=Products
PIE_NAME_2=Services
PIE_NAME_3=Other
PIE_LABEL_FORMAT=#VALUE# (#PERCENTAGE#)
SERIE_DATA_1=94|48|28
SERIE_FONT_1=ARIAL|BOLD|12
SERIE_LABELS_1=Products|Services|Other
SERIE_TIPS_1=Click to see PRODUCT \nsales by continent|Click to see SERVICES
\nsales by continent|Click to see OTHER \nsales by continent
CHART_SHOW_TIPS=true
CHART_POINT_SELECTION=true
SERIE_TOGETHER_1=true|false|true
CHART_BORDER=0.2|BLACK|LINE
CHART_FILL=LIGHTGRAY
LEGEND_BORDER=0.2|BLACK|LINE
LEGEND_VERTICAL=false
LEGEND_POSITION=TOP
LEGEND_FILL=WHITE
PIECHART_3D=true
BACK_IMAGE=back19.jpg
The result is:
Each point ,bar or slice of your chart will have an associated sub-chart which must be loaded when the user clicks on the item. The Java code to do this would be something like:
chart.activateSelection=true;
chart.addChartListener( new ChartAdapter() {
public void chartEvent(Chart chart,int type) {
// process event here
if (type==ChartListener.EVENT_POINT_CLICKED) {// load definition of subchart
if (chart.selectedSeriePoint==0) myChartLoader.loadFromFile("subchart1",true);
elseif (chart.selectedSeriePoint==1) myChartLoader.loadFromFile("subchart2",true);
elseif (chart.selectedSeriePoint==2) myChartLoader.loadFromFile("subchart3",true);
// rebuild chart
myChartLoader.build(chart,false,false);
// repaint chart on the window
myChartViewer.redraw();
}
}
});
That function will then load the new chart from one of the data files subchart1, subchart2 or subchart3 depending on the slice the users clicked on.
The content of subchart1 can be:
TITLECHART=Sales Products
LEGEND=TRUE
SERIE_1=Pie
SERIE_TYPE_1=PIE
PIE_STYLE_1=RED
PIE_STYLE_2=BLUE
PIE_STYLE_3=GREEN
PIE_STYLE_4=YELLOW
PIE_NAME_1=America
PIE_NAME_2=Europe
PIE_NAME_3=Asia
PIE_NAME_4=Other
PIE_LABEL_FORMAT=#VALUE# (#PERCENTAGE#)
SERIE_DATA_1=14|48|28|78
SERIE_FONT_1=ARIAL|BOLD|12
SERIE_LABELS_1=America|Europe|Asia|Other
CHART_BORDER=0.2|BLACK|LINE
CHART_FILL=LIGHTGRAY
LEGEND_BORDER=0.2|BLACK|LINE
LEGEND_VERTICAL=false
LEGEND_POSITION=TOP
LEGEND_FILL=WHITE
PIECHART_3D=true
BACK_IMAGE=back19.jpg
CHART_JAVASCRIPT_EVENTS=false
SERIE_TIPS_1=America|Europe|Asia|Other
CHART_SHOW_TIPS=true
When the user click on
the red slice, the following subchart will be loaded:
